Remove Code Remove Java Remove Monitoring Remove Servers
article thumbnail

Fully automatic code level monitoring and extended version support for AIX

Dynatrace

In our continuous effort to enhance Dynatrace on all fronts, here are a couple of important improvements to AIX monitoring that we’re introducing with OneAgent version 1.175. Fully automatic deep code monitoring module injection. is still present in many of the environments monitored by Dynatrace.

Code 128
article thumbnail

Unmatched scalability and security of Dynatrace extensions now available for all supported technologies: 7 reasons to migrate your JMX and Python plugins

Dynatrace

already address SNMP, WMI, SQL databases, and Prometheus technologies, serving the monitoring needs of hundreds of Dynatrace customers. JMX monitoring extensions are currently being migrated. Extensions can monitor virtually any type of technology in your environment. and focusing on a much-improved version 2.0 Extensions 2.0

Insiders

Sign Up for our Newsletter

This site is protected by reCAPTCHA and the Google Privacy Policy and Terms of Service apply.

Trending Sources

article thumbnail

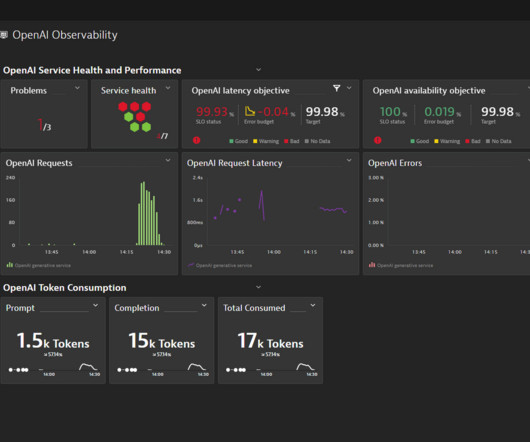
Dynatrace automatically monitors OpenAI ChatGPT for companies that deliver reliable, cost-effective services powered by generative AI

Dynatrace

OneAgent automatic injection of monitoring and tracing code works not only for the NodeJS language binding but also when using the raw HTTPS request in NodeJS. OneAgent can automatically monitor all C#,NET, Java, Go, and NodeJS bindings. For further details, you can view the full source of the NodeJS service on GitHub.

article thumbnail

Radically speed up your code by fixing slow or frequent garbage collection

Dynatrace

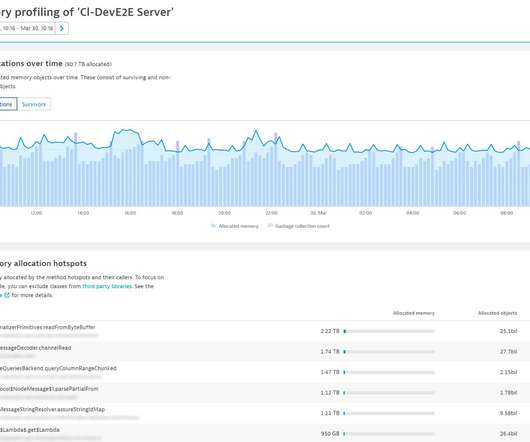
Java Memory Management, with its built-in garbage collection, is one of the language’s finest achievements. However, garbage collection is one of the main sources of performance and scalability issues in any modern Java application. Optimize your code by finding and fixing the root cause of garbage collection problems.

Speed 165
article thumbnail

Improved PHP monitoring with even less overhead!

Dynatrace

Anything you want to do on a web server, you can do with PHP. Here are some statistics: PHP now accounts for about 79% of the server-side programming used on the Internet. for ASP.NET, which is a web framework, and 4% for Java. Dynatrace improves AI-powered PHP monitoring. MsSQL sensors for PHP monitoring.

article thumbnail

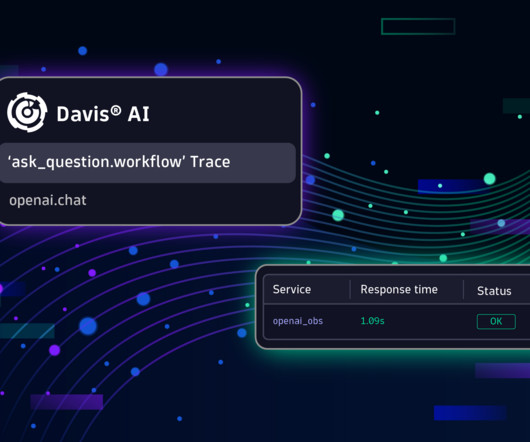
Enhanced AI model observability with Dynatrace and Traceloop OpenLLMetry

Dynatrace

Resource consumption: Observing computational resource availability and saturation, whether deployed in cloud-native environments like Kubernetes or CPU-enabled servers. Data quality and drift: Monitoring the quality and characteristics of training and runtime data to detect significant changes that might impact model accuracy.

article thumbnail

Dynatrace and Red Hat expand enterprise observability to edge computing

Dynatrace

Application observability also helps to improve end-user experiences when combined with Dynatrace Digital Experience monitoring. ActiveGate acts as a secure proxy and compresses and routes observability signals in an optimized manner to Dynatrace servers. Data is integrated seamlessly with Kubernetes topology.

Retail 255