Remove Case Study Remove Google Remove Metrics Remove Traffic
article thumbnail

Improving Core Web Vitals, A Smashing Magazine Case Study

Smashing Magazine

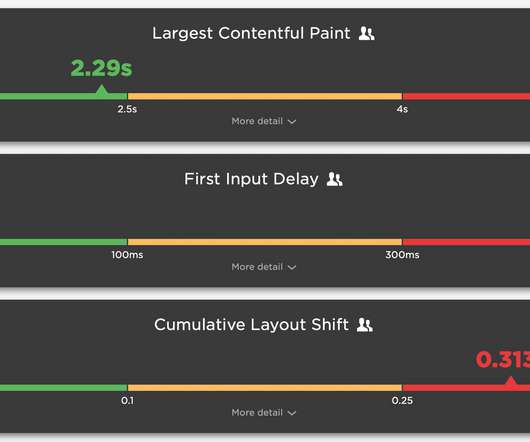
Improving Core Web Vitals, A Smashing Magazine Case Study. Improving Core Web Vitals, A Smashing Magazine Case Study. LCP, or Largest Contentful Paint , is one of the three Core Web Vitals that you must “pass” to get the full search ranking boost from Google as part of their Page Experience Update. Barry Pollard.
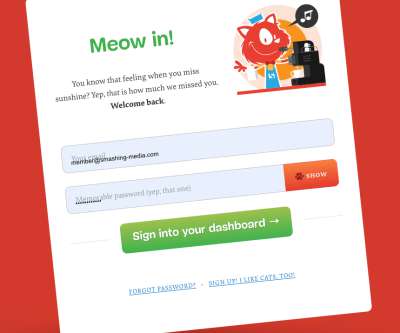
Google 143
article thumbnail

Hello INP! Here's everything you need to know about the newest Core Web Vital

Speed Curve

After years of development and testing, Google has added Interaction to Next Paint (INP) to its trifecta of Core Web Vitals – the performance metrics that are a key ingredient in its search ranking algorithm. INP replaces First Input Delay (FID) as the Vitals responsiveness metric. This is what the INP metric assesses."

Mobile 82
Insiders

Sign Up for our Newsletter

This site is protected by reCAPTCHA and the Google Privacy Policy and Terms of Service apply.

Trending Sources

article thumbnail

How to Estimate Web Performance Impact Before Making Fixes

Jos

Web Performance is important for user experience and business metrics. Look, there are many case studies proving a correlation between loading time and business metrics!” ?-?I Using Test My Site from Think with Google : Gives you an estimation of potential revenue increase for your site when saving loading time.

article thumbnail

SEO and web performance: What to measure and how to optimize

Speed Curve

Chances are, you're here because of Google's update to its search algorithm , which affects both desktop and mobile, and which includes Core Web Vitals as a ranking factor. The metrics that comprise Web Vitals are still evolving. These metrics will (I think) always be in a state of evolution. When Google talks, people listen.

article thumbnail

Fostering a Web Performance Culture

Jos

Google’s Lighthouse is one of them, which shows information about PWA, SEO and more. presented in Google IO 2018 ( source ) These tools make it easier to determine where we need to put emphasis to improve our sites. One could argue this is a metric-driven decision. A screenshot of Lighthouse 3.0, Well, not so fast.

article thumbnail

How to use Server Timing to get backend transparency from your CDN

Speed Curve

However, that pesky 20% on the back end can have a big impact on downstream metrics like First Contentful Paint (FCP), Largest Contentful Paint (LCP), and any other 'loading' metric you can think of. Google recommends that TTFB be 800ms at the 75th percentile. That performance golden rule still holds true today.

Servers 57
article thumbnail

10 things I love about SpeedCurve (that I think you'll love, too)

Speed Curve

The best way to fight regressions is to create performance budgets on key metrics, and get alerted when they go out of bounds. These charts let even the most non-technical stakeholder easily see the correlation between performance and user engagement and business metrics, such as bounce rate and conversion rate.