

PerformanceObserver and Paint Timing API
Jos
JUNE 17, 2017
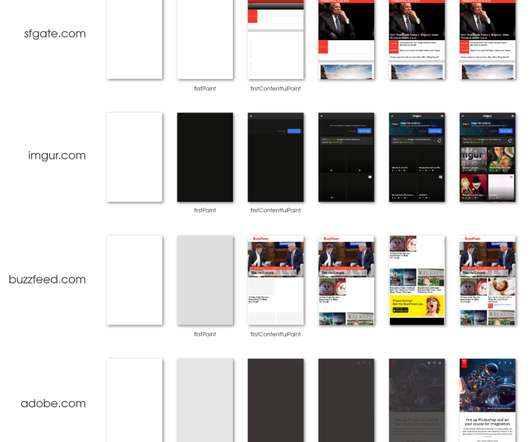
In a recent post about Chrome 60 Beta , Google announced the support of the Paint Timing API to get metrics on when your page starts rendering and when the user gets content that can be consumed (more info on the definition of the events below). Here I’m going to describe this new API a bit and show you how to use it.


Let's personalize your content