article thumbnail

What are quality gates? How to use quality gates to deliver better software at speed and scale

Dynatrace

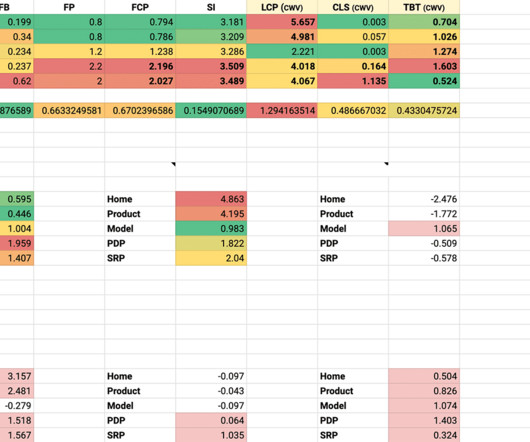
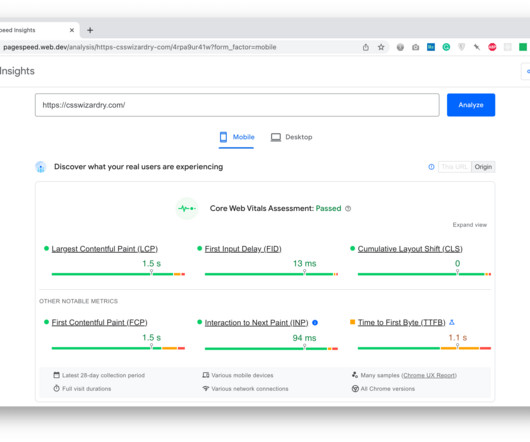
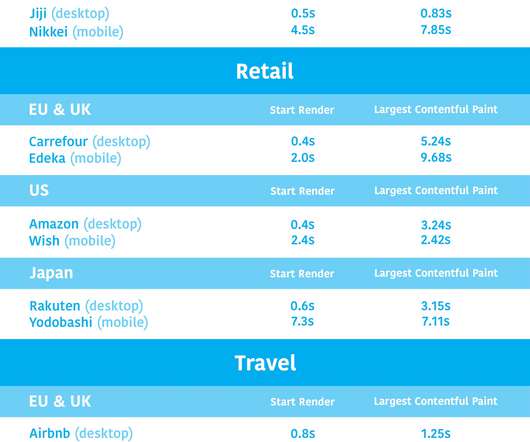
Automating quality gates is ideal, as it minimizes manually checking and validating key metrics throughout the SDLC. By actively monitoring metrics such as error rate, success rate, and CPU load, quality gates instill confidence in teams during software releases. Several tools can be used to collect metrics in load/performance testing.

Speed 208
article thumbnail

Site-Speed Topography Remapped

CSS Wizardry

This is an update to my 2020 article Site-Speed Topography. Around two and a half years ago, I debuted my Site-Speed Topography technique for getting broad view of an entire site’s performance from just a handful of key URLs and some readily available metrics. What Is Site-Speed Topography? By how much?

Speed 131
Insiders

Sign Up for our Newsletter

This site is protected by reCAPTCHA and the Google Privacy Policy and Terms of Service apply.

Trending Sources

article thumbnail

Site-Speed Topography

CSS Wizardry

When first working on a new site-speed engagement, you need to work out quickly where the slowdowns, blindspots, and inefficiencies lie. Any time you run a test with WebPageTest, you’ll get this table of different milestones and metrics. Higher variance means a less stable metric across pages. Visualising the Data.

Speed 292
article thumbnail

Crucial Redis Monitoring Metrics You Must Watch

Scalegrid

You will need to know which monitoring metrics for Redis to watch and a tool to monitor these critical server metrics to ensure its health. Redis returns a big list of database metrics when you run the info command on the Redis shell. You can pick a smart selection of relevant metrics from these.

Metrics 130
article thumbnail

Five-nines availability: Always-on infrastructure delivers system availability during the holidays’ peak loads

Dynatrace

The nirvana state of system uptime at peak loads is known as “five-nines availability.” In its pursuit, IT teams hover over system performance dashboards hoping their preparations will deliver five nines—or even four nines—availability. But is five nines availability attainable? Downtime per year. 90% (one nine).

article thumbnail

Create compelling insights into business and operational KPIs through metric calculations in the Data explorer

Dynatrace

Metrics matter. But without complex analytics to make sense of them in context, metrics are often too raw to be useful on their own. To achieve relevant insights, raw metrics typically need to be processed through filtering, aggregation, or arithmetic operations. Examples of metric calculations. Dynatrace news.

Metrics 246
article thumbnail

Answering Common Questions About Interpreting Page Speed Reports

Smashing Magazine

Answering Common Questions About Interpreting Page Speed Reports Answering Common Questions About Interpreting Page Speed Reports Geoff Graham 2023-10-31T16:00:00+00:00 2023-10-31T17:06:18+00:00 This article is sponsored by DebugBear Running a performance check on your site isn’t too terribly difficult. Can’t be perfect every time!

Speed 97