Remove Availability Remove Media Remove Metrics Remove Retail
article thumbnail

The new normal of digital experience delivery – lessons learned from monitoring mission-critical websites during COVID-19

Dynatrace

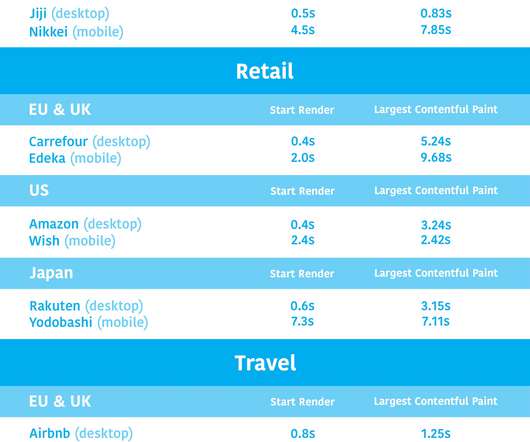
Over the last two month s, w e’ve monito red key sites and applications across industries that have been receiving surges in traffic , including government, health insurance, retail, banking, and media. Readers who share our privacy concerns, please note, all the data we monitor is publicly available. .

Website 215
article thumbnail

Understanding the Importance of 5 Nines Availability

IO River

What is 5 Nines Availability?In determining a business's value to its clients, the level of service it provides is often a key metric. However, consumers often prioritize availability in many systems. Within this range, Five Nines availability is often considered the gold standard for availability in critical systems.

Insiders

Sign Up for our Newsletter

This site is protected by reCAPTCHA and the Google Privacy Policy and Terms of Service apply.

Trending Sources

article thumbnail

Understanding the Importance of 5 Nines Availability

IO River

What is 5 Nines Availability?In determining a business's value to its clients, the level of service it provides is often a key metric. However, consumers often prioritize availability in many systems. Within this range, Five Nines availability is often considered the gold standard for availability in critical systems.

article thumbnail

How digital experience monitoring helps deliver business observability

Dynatrace

Fast, consistent application delivery creates a positive user experience that can ultimately drive customer loyalty and improve business metrics like conversion rate and user retention. DEM can give organizations business observability—insight into the effects of user experience on the bottom line. Endpoint monitoring (EM).

article thumbnail

Industry page speed benchmarks (March 2022)

Speed Curve

Page Speed Benchmarks is an interactive dashboard that lets you explore and compare web performance data for leading websites across several industries – from retail to media – over the past year. Key metrics. These visuals are a great tool for validating the best metrics to focus on for your pages.

article thumbnail

To understand the risks posed by AI, follow the money

O'Reilly

Market structure is not simply the number of firms, but the cost structure and economic incentives in the market that follow from the institutions, adjacent government regulations, and available financing. For social media platforms, this was addictive content to increase time spent on platform at any cost to user health.

article thumbnail

Introducing Page Speed Benchmarks – a new resource for the performance community

Speed Curve

Here are some common questions I’m asked when I talk with people about performance: Which metrics should I care about? Page Speed Benchmarks is an interactive dashboard that lets you explore and compare web performance data for leading websites across several industries – from retail to media. How fast should I be?