Remove Availability Remove Engineering Remove Metrics Remove Monitoring
article thumbnail

How platform engineering and IDP observability can accelerate developer velocity

Dynatrace

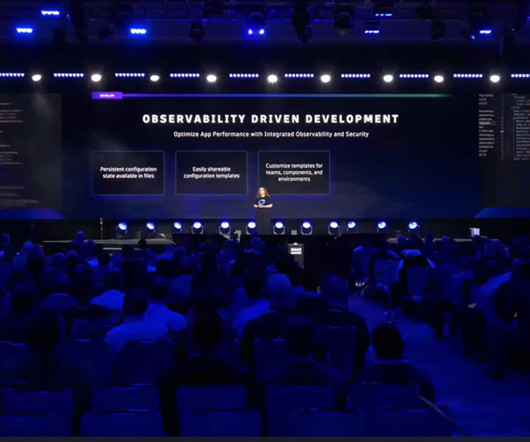
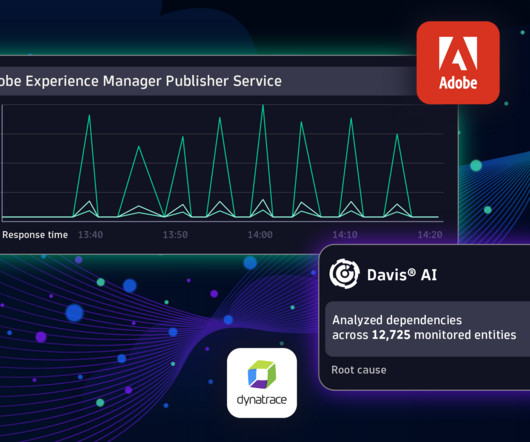
As organizations look to expand DevOps maturity, improve operational efficiency, and increase developer velocity, they are embracing platform engineering as a key driver. The pair showed how to track factors including developer velocity, platform adoption, DevOps research and assessment metrics, security, and operational costs.

article thumbnail

Observability engineering: Getting Prometheus metrics right for Kubernetes with Dynatrace and Kepler

Dynatrace

For busy site reliability engineers, ensuring system reliability, scalability, and overall health is an imperative that’s getting harder to achieve in ever-expanding, cloud-native, container-based environments. To get a more granular look into telemetry data, many analysts rely on custom metrics using Prometheus. What is Prometheus?

Metrics 175
Insiders

Sign Up for our Newsletter

This site is protected by reCAPTCHA and the Google Privacy Policy and Terms of Service apply.

Trending Sources

article thumbnail

Unlock the Power of DevSecOps with Newly Released Kubernetes Experience for Platform Engineering

Dynatrace

Platform engineering is on the rise. According to leading analyst firm Gartner, “80% of software engineering organizations will establish platform teams as internal providers of reusable services, components, and tools for application delivery…” by 2026. All important health signals are highlighted.

article thumbnail

Unmatched scalability and security of Dynatrace extensions now available for all supported technologies: 7 reasons to migrate your JMX and Python plugins

Dynatrace

already address SNMP, WMI, SQL databases, and Prometheus technologies, serving the monitoring needs of hundreds of Dynatrace customers. JMX monitoring extensions are currently being migrated. Extensions can monitor virtually any type of technology in your environment. Comprehensive metrics support Extensions 2.0

article thumbnail

Automating Success: Building a better developer experience with platform engineering

Dynatrace

When it comes to platform engineering, not only does observability play a vital role in the success of organizations’ transformation journeys—it’s key to successful platform engineering initiatives. The various presenters in this session aligned platform engineering use cases with the software development lifecycle.

article thumbnail

Flexible, scalable, self-service Kubernetes native observability now in General Availability

Dynatrace

From a cost perspective, internal customers waste valuable time sending tickets to operations teams asking for metrics, logs, and traces to be enabled. A team looking for metrics, traces, and logs no longer needs to file a ticket to get their app monitored in their own environments. Monitoring such an application is easy.

article thumbnail

Redis® Monitoring Strategies for 2024

Scalegrid

In today’s data-driven world, the ability to effectively monitor and manage data is of paramount importance. With its widespread use in modern application architectures, understanding the ins and outs of Redis® monitoring is essential for any tech professional. Redis®, a powerful in-memory data store, is no exception.

Strategy 130