Remove Availability Remove Code Remove Event Remove Infrastructure
article thumbnail

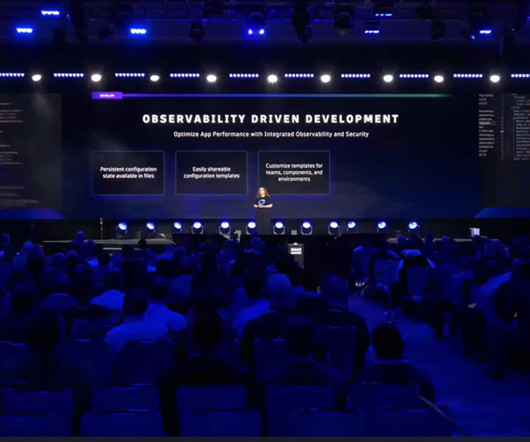
Flexible, scalable, self-service Kubernetes native observability now in General Availability

Dynatrace

To solve this problem , Dynatrace offers a fully automated approach to infrastructure and application observability including Kubernetes control plane, deployments, pods, nodes, and a wide array of cloud-native technologies. None of this complexity is exposed to application and infrastructure teams.

article thumbnail

Dynatrace observability is now available for Red Hat OpenShift on the IBM® Power® architecture

Dynatrace

Red Hat OpenShift monitoring with Dynatrace stands out due to the following key aspects: Infrastructure health monitoring and optimization: Assess the status of your infrastructure at a glance, understand resource consumption, optimize resource allocation for cost-efficiency, and track software versions running within the Kubernetes environment.

Insiders

Sign Up for our Newsletter

This site is protected by reCAPTCHA and the Google Privacy Policy and Terms of Service apply.

Trending Sources

article thumbnail

How platform engineering and IDP observability can accelerate developer velocity

Dynatrace

Platform engineering creates and manages a shared infrastructure and set of tools, such as internal developer platforms (IDPs) , to enable software developers to build, deploy, and operate applications more efficiently. As a result, teams can focus on writing code and building features rather than dealing with infrastructure nuances.

article thumbnail

Monitoring of Kubernetes Infrastructure for day 2 operations

Dynatrace

One of the promises of container orchestration platforms is to make i t easier for the developers to accelerate the deployment of their app lication s without having to worry about scalability and infrastructure dependencies. Kubernetes events are a type of object providing context on what ’s happening inside a cluster.

article thumbnail

The Ultimate Guide to Database High Availability

Percona

To make data count and to ensure cloud computing is unabated, companies and organizations must have highly available databases. This guide provides an overview of what high availability means, the components involved, how to measure high availability, and how to achieve it. How does high availability work?

article thumbnail

AI-powered DNS request tracking extends infrastructure observability for high quality network traffic

Dynatrace

The Dynatrace Software Intelligence Platform gives you a complete Infrastructure Monitoring solution for the monitoring of cloud platforms and virtual infrastructure, along with log monitoring and AIOps. Ensure high quality network traffic by tracking DNS requests out-of-the-box. Average query response time. What’s next.

Traffic 264
article thumbnail

Expand application and infrastructure observability with operational insights into Kubernetes pods

Dynatrace

Dynatrace is the only Kubernetes monitoring solution that provides continuous automation and full-stack advanced observability without changing code, container images, or deployments. A pending pod is one that’s already available in the Kubernetes system but not yet successfully running on a node. Dynatrace news.