Remove Availability Remove Benchmarking Remove Google Remove Speed
article thumbnail

Industry page speed benchmarks (March 2022)

Speed Curve

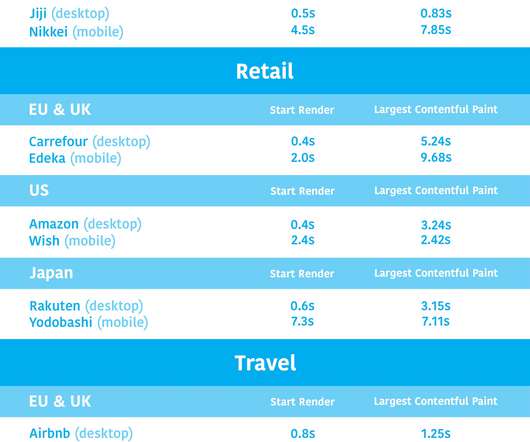
Page Speed Benchmarks is an interactive dashboard that lets you explore and compare web performance data for leading websites across several industries – from retail to media – over the past year. LCP is one of Google's Core Web Vitals , so it should be on your radar, especially if you care about SEO.

article thumbnail

In Defence of DOM­Content­Loaded

CSS Wizardry

I never thought I’d write an article in defence of DOMContentLoaded , but here it is… For many, many years now, performance engineers have been making a concerted effort to move away from technical metrics such as Load , and toward more user-facing, UX metrics such as Speed Index or Largest Contentful Paint. for the vast minority of sessions.

Metrics 326
Insiders

Sign Up for our Newsletter

This site is protected by reCAPTCHA and the Google Privacy Policy and Terms of Service apply.

Trending Sources

article thumbnail

New web performance insights with additional metrics and enhanced Visually complete for synthetic monitors

Dynatrace

Dynatrace Synthetic Monitoring allows you to proactively monitor the availability of your public as well as your internal web applications and API endpoints from locations around the globe or important internal locations such as branch offices. These metrics are tightly connected to the perceived load speed of your application.

Metrics 211
article thumbnail

What is software automation? Optimize the software lifecycle with intelligent automation

Dynatrace

Consider how AI-enabled chatbots such as ChatGPT and Google Bard help DevOps teams write code snippets or resolve problems in custom code without time-consuming human intervention. DevSecOps and ITOps teams can then perform tasks with accuracy at the speed a business requires. Operations. Applications and microservices monitoring.

Software 184
article thumbnail

How to use Server Timing to get backend transparency from your CDN

Speed Curve

Google recommends that TTFB be 800ms at the 75th percentile. Looking at the industry benchmarks for US retailers , four well-known sites have backend times that are approaching – or well beyond – that threshold. This data is available by enabling the mPulse behavior in property manager.

Servers 57
article thumbnail

An Opinionated Guide to Performance Budgets

Speed Curve

Web pages are unbelievably complex, and there are hundreds of different metrics available to track. Throughout this post I've used examples from our public Industry Benchmarks dashboard , which I'd encourage you to check out so that you can explore these metrics on your own. Is it loading? Here are some metrics to consider. >

article thumbnail

10 things I love about SpeedCurve (that I think you'll love, too)

Speed Curve

Fighting regressions should be the top priority of anyone who cares about the speed of their site. Benchmark your site against your competitors Our public-facing Industry Benchmarks dashboard gets a lot of visits, but did you know you can create your own custom competitive benchmarking dashboard in SpeedCurve?