article thumbnail

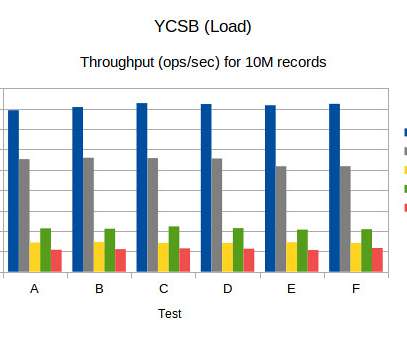
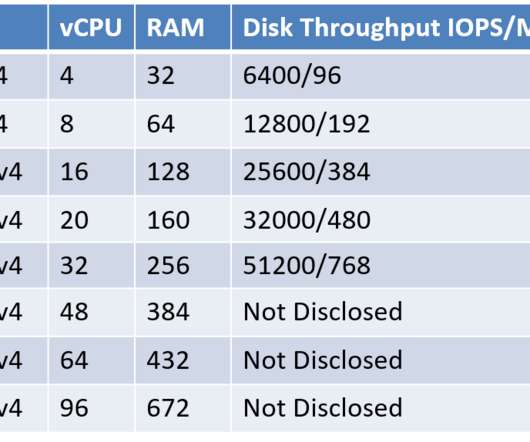
Benchmark (YCSB) numbers for Redis, MongoDB, Couchbase2, Yugabyte and BangDB

High Scalability

Application example: user profile cache, where profiles are constructed elsewhere (e.g., All of these dbs are available free of cost for download / install and it will be fairly straightforward to run these tests in your environment for further analysis. Workload C: Read only. This workload is 100% read.

article thumbnail

Crucial Redis Monitoring Metrics You Must Watch

Scalegrid

Key metrics like throughput, request latency, and memory utilization are essential for assessing Redis health, with tools like the MONITOR command and Redis-benchmark for latency and throughput analysis and MEMORY USAGE/STATS commands for evaluating memory. Cache Hit Ratio The cache hit ratio represents the efficiency of cache usage.

Metrics 130
Insiders

Sign Up for our Newsletter

This site is protected by reCAPTCHA and the Google Privacy Policy and Terms of Service apply.

Trending Sources

article thumbnail

How to use Server Timing to get backend transparency from your CDN

Speed Curve

Looking at the industry benchmarks for US retailers , four well-known sites have backend times that are approaching – or well beyond – that threshold. Pagespeed Benchmarks - US Retail - LCP When you examine a waterfall, it's pretty obvious that TTFB is the long pole in the tent, pushing out render times for the page.

Servers 58
article thumbnail

Impact of Querying Table Information From information_schema

Percona

Disclaimer : This blog post is meant to show a less-known problem but is not meant to be a serious benchmark. having to open each table.frm (and in which my test runs, I have purposely read a very high number of tables compared to “Table-open-cache” variable). Results for Percona Server for MySQL 8.0 While you are on 5.7,

Cache 99
article thumbnail

20X Faster Backup Preparation With Percona XtraBackup 8.0.33-28!

Percona

After the “data dictionary” (DD) engine and DD cache are initialized on a server, the Storage Engines can ask for a table definition. Initializing a DD engine and the cache adds complexity and other server dependencies. Essentially LRU cache is disabled by loading the tables as non-evictable. CREATE TABLE test.t1(a

Cache 83
article thumbnail

MySQL Key Performance Indicators (KPI) With PMM

Percona

Database uptime and availability Monitoring database uptime and availability is crucial as it directly impacts the availability of critical data and the performance of applications or websites that rely on the MySQL database. This KPI is also directly related to Query Performance and helps improve it.

article thumbnail

PostgreSQL Performance Tuning: Optimizing Database Parameters for Maximum Efficiency

Percona

Connection pooling: Minimizing connection overhead and improving response times for frequently accessed data by implementing mechanisms for connection pooling and caching strategies. PostgreSQL performance optimization is an ongoing process involving monitoring, benchmarking, and adjustments to maintain high-performing PostgreSQL databases.

Tuning 52