Remove Analytics Remove Database Remove Monitoring Remove Servers
article thumbnail

Intelligent observability for Oracle and SQL databases

Dynatrace

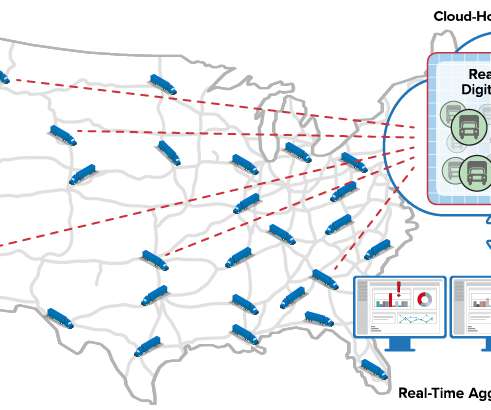
While applications are built using a variety of technologies and frameworks, there is one thing they usually have in common: the data they work with must be stored in databases. Now, Dynatrace has gone a step further and expanded its coverage and intelligent observability into the next layer: database infrastructure.

Database 241
article thumbnail

Easily monitor IBM i with updated Dynatrace extension

Dynatrace

IBM i, formerly known as iSeries, is an operating system developed by IBM for its line of IBM i Power Systems servers. It also includes various built-in software components for database management, security, and application development. It then collects performance data using existing database services running on your system.

Insiders

Sign Up for our Newsletter

This site is protected by reCAPTCHA and the Google Privacy Policy and Terms of Service apply.

Trending Sources

article thumbnail

Redis® Monitoring Strategies for 2024

Scalegrid

In today’s data-driven world, the ability to effectively monitor and manage data is of paramount importance. With its widespread use in modern application architectures, understanding the ins and outs of Redis® monitoring is essential for any tech professional. Redis®, a powerful in-memory data store, is no exception.

Strategy 130
article thumbnail

AI-powered infrastructure monitoring for your SAP HANA database (Preview)

Dynatrace

If you’re running SAP, you’re likely already familiar with the HANA relational database management system. HANA maintains all the business and analytics data that your business runs on. Don’t worry, when it comes to SAP monitoring, Dynatrace has you covered. Simplify SAP HANA performance monitoring and analysis.

article thumbnail

Extend business observability: Extract business events from online databases (Part 2)

Dynatrace

In part 2, we’ll show you how to retrieve business data from a database, analyze that data using dashboards and ad hoc queries, and then use a Davis analyzer to predict metric behavior and detect behavioral anomalies. Dynatrace users typically use extensions to pull technical monitoring data, such as device metrics, into Dynatrace.

Database 269
article thumbnail

Automatic connection of logs and traces accelerates AI-driven cloud analytics

Dynatrace

Starting with user interactions, PurePath technology automatically collects all code execution details, executed database statements, critical transaction-based metrics, and topology information end-to-end. This provides a holistic view, advanced analytics, and AI-powered answers for cloud optimization and troubleshooting.

Analytics 224
article thumbnail

TTP-based threat hunting with Dynatrace Security Analytics and Falco Alerts solves alert noise

Dynatrace

In this blog post, we’ll use Dynatrace Security Analytics to go threat hunting, bringing together logs, traces, metrics, and, crucially, threat alerts. Likewise, operation specialists can prioritize their efforts on monitoring the highest-risk tactics, and executives can better communicate the business risk.

Analytics 195