Remove Analytics Remove Code Remove Metrics Remove Servers
article thumbnail

TTP-based threat hunting with Dynatrace Security Analytics and Falco Alerts solves alert noise

Dynatrace

In this blog post, we’ll use Dynatrace Security Analytics to go threat hunting, bringing together logs, traces, metrics, and, crucially, threat alerts. Instead, we want to focus on detecting and stopping attacks before they happen: In your applications, in context, at the exact line of code that is vulnerable and in use.


Analytics 189
article thumbnail

The road to observability with OpenTelemetry demo part 1: Identifying metrics and traces

Dynatrace

That is, relying on metrics, logs, and traces to understand what software is doing and where it’s running into snags. When software runs in a monolithic stack on on-site servers, observability is manageable enough. In addition to tracing, observability also defines two other key concepts, metrics and logs. What is OpenTelemetry?

Metrics 174
Insiders

Sign Up for our Newsletter

This site is protected by reCAPTCHA and the Google Privacy Policy and Terms of Service apply.

Trending Sources

article thumbnail

Unmatched scalability and security of Dynatrace extensions now available for all supported technologies: 7 reasons to migrate your JMX and Python plugins

Dynatrace

focused on technology coverage, building on the flexibility of JMX for Java and Python-based coded extensions for everything else. While Python code can address most data acquisition and ingest requirements, it comes at the cost of complexity in implementation and use-case modeling. Comprehensive metrics support Extensions 2.0

article thumbnail

Dynatrace and Red Hat expand enterprise observability to edge computing

Dynatrace

As an example, many retailers already leverage containerized workloads in-store to enhance customer experiences using video analytics or streamline inventory management using RFID tracking for improved security. ActiveGate acts as a secure proxy and compresses and routes observability signals in an optimized manner to Dynatrace servers.

Retail 251
article thumbnail

In Defence of DOM­Content­Loaded

CSS Wizardry

I never thought I’d write an article in defence of DOMContentLoaded , but here it is… For many, many years now, performance engineers have been making a concerted effort to move away from technical metrics such as Load , and toward more user-facing, UX metrics such as Speed Index or Largest Contentful Paint. Or are they…?

Metrics 326
article thumbnail

Intelligent observability for Oracle and SQL databases

Dynatrace

Dynatrace Application Performance Management (APM) has long provided multiple options for database monitoring, including deep insights into code and statements, service level visibility, connection pool monitoring, and more. Easily track the health and performance of database servers with AI support.

Database 237
article thumbnail

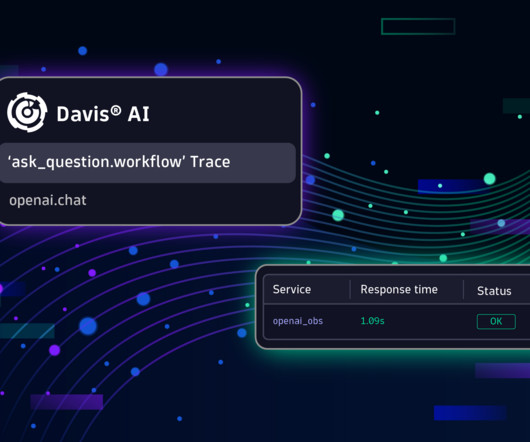
Enhanced AI model observability with Dynatrace and Traceloop OpenLLMetry

Dynatrace

Resource consumption: Observing computational resource availability and saturation, whether deployed in cloud-native environments like Kubernetes or CPU-enabled servers. OpenTelemetry has become a standard for collecting traces, metrics, and logs. Maintained under the Apache 2.0 However, Python models are trickier.