Remove Analysis Remove Infrastructure Remove Innovation Remove Metrics
article thumbnail

Dynatrace innovates again with the release of topology-driven auto-adaptive metric baselines

Dynatrace

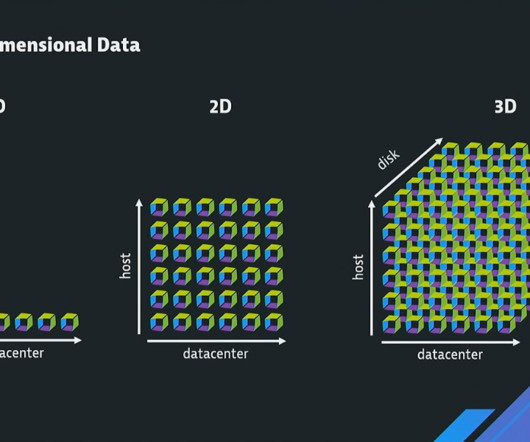
With the advent and ingestion of thousands of custom metrics into Dynatrace, we’ve once again pushed the boundaries of automatic, AI-based root cause analysis with the introduction of auto-adaptive baselines as a foundational concept for Dynatrace topology-driven timeseries measurements. Custom log metrics.

Metrics 207
article thumbnail

Ingesting JMeter, temperature and humidity metrics: A Dynatrace innovation day report

Dynatrace

Dynatrace has recently enhanced its Metrics APIs, allowing everyone to send any type of metric with any set of data dimension to Davis, Dynatrace’s AI engine. In our conversation, I mentioned the new Dynatrace Metrics ingestion and off we went. ?? There are many use cases for using this API.

Insiders

Sign Up for our Newsletter

This site is protected by reCAPTCHA and the Google Privacy Policy and Terms of Service apply.

Trending Sources

article thumbnail

Accelerating innovation with Kubernetes and Dynatrace

Dynatrace

Running workloads on top of Kubernetes is significantly valuable, not just for application teams, but for infrastructure teams as well. When it comes to observing Kubernetes environments, your approach must be rooted in metrics, logs, and traces —and also the context in which things happen and their impact on users.

article thumbnail

Managing hybrid cloud infrastructure with an observability platform

Dynatrace

While many companies now enlist public cloud services such as Amazon Web Services, Google Public Cloud, or Microsoft Azure to achieve their business goals, a majority also use hybrid cloud infrastructure to accommodate traditional applications that can’t be easily migrated to public clouds. How to modernize for hybrid cloud.

article thumbnail

Any analysis, any time: Dynatrace Log Management and Analytics powered by Grail

Dynatrace

Log management and analytics is an essential part of any organization’s infrastructure, and it’s no secret the industry has suffered from a shortage of innovation for several years. Still, it is critical to collect, store, and make easily accessible these massive amounts of log data for analysis.

Analytics 231
article thumbnail

What is observability? Not just logs, metrics and traces

Dynatrace

In IT and cloud computing, observability is the ability to measure a system’s current state based on the data it generates, such as logs, metrics, and traces. An advanced observability solution can also be used to automate more processes, increasing efficiency and innovation among Ops and Apps teams.

Metrics 363
article thumbnail

Data lakehouse innovations advance the three pillars of observability for more collaborative analytics

Dynatrace

The short answer: The three pillars of observability—logs, metrics, and traces—converging on a data lakehouse. You’re getting all the architectural benefits of Grail—the petabytes, the cardinality—with this implementation,” including the three pillars of observability: logs, metrics, and traces in context.

Analytics 182