Remove Analysis Remove Code Remove Monitoring Remove Tuning
article thumbnail

Multidimensional analysis 2.0: Analyze microservice-based metrics without code changes (Part 2)

Dynatrace

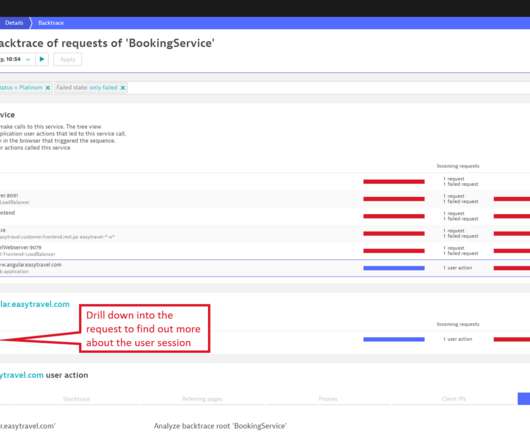
In Part 1 of this blog series , we presented a few Dynatrace customer use cases for multidimensional analysis. To start your analysis, select Diagnostic tools from the navigation menu and select Multidimensional analysis. To find out, select the Backtrace button at the top-right corner of the Failure analysis page (see below).

Metrics 166
article thumbnail

Crucial Redis Monitoring Metrics You Must Watch

Scalegrid

You will need to know which monitoring metrics for Redis to watch and a tool to monitor these critical server metrics to ensure its health. These can help you ensure your system’s health and quickly perform root cause analysis of any performance-related issue you might be encountering.

Metrics 130
Insiders

Sign Up for our Newsletter

This site is protected by reCAPTCHA and the Google Privacy Policy and Terms of Service apply.

Trending Sources

article thumbnail

Why log monitoring and log analytics matter in a hyperscale world

Dynatrace

Log monitoring, log analysis, and log analytics are more important than ever as organizations adopt more cloud-native technologies, containers, and microservices-based architectures. “Logging” is the practice of generating and storing logs for later analysis. What is log monitoring? Dynatrace news.

Analytics 214
article thumbnail

Dynatrace Named a Leader and Positioned Furthest for Vision and Highest in Execution in the 2023 Gartner® Magic Quadrant™ for Application Performance Monitoring and Observability

Dynatrace

Dynatrace also named a Gartner Customers’ Choice Customers also named Dynatrace a Customers’ Choice in the latest Gartner® Peer Insights™ Voice of the Customer: Application Performance Monitoring report, from November 2022. In these two reports, Dynatrace is the only provider to be recognized as a Leader and as a Customers’ Choice.

article thumbnail

Telltale: Netflix Application Monitoring Simplified

The Netflix TechBlog

You’re half awake and wondering, “Is there really a problem or is this just an alert that needs tuning? Over the years we’ve learned from on-call engineers about the pain points of application monitoring: too many alerts, too many dashboards to scroll through, and too much configuration and maintenance. By Andrei U.,

article thumbnail

Migrating Critical Traffic At Scale with No Downtime?—?Part 1

The Netflix TechBlog

Migrating Critical Traffic At Scale with No Downtime — Part 1 Shyam Gala , Javier Fernandez-Ivern , Anup Rokkam Pratap , Devang Shah Hundreds of millions of customers tune into Netflix every day, expecting an uninterrupted and immersive streaming experience. This technique facilitates validation on multiple fronts.

Traffic 339
article thumbnail

Dynatrace log collection for ARM unlocks power-efficient architecture for your enterprise

Dynatrace

As organizations look to take ownership of their total ecological footprint and help mitigate climate change, it’s critically important for organizations to measure, monitor, and reduce their IT carbon footprints. Initiatives like the Carbon Impact app can be used to measure the footprint of monitored ARM-based hosts compared to x86 hosts.