Remove Analysis Remove Cache Remove Latency Remove Metrics
article thumbnail

AI-driven analysis of Spring Micrometer metrics in context, with typology at scale

Dynatrace

Micrometer is used for instrumenting both out-of-the-box and custom metrics from Spring Boot applications. Since Micrometer conforms data to the right form and then sends it off for analysis, companies need an easy way to analyze massive amounts of data , get actionable insights in real time, and interpret the resulting alerts and responses.

Metrics 203
article thumbnail

Crucial Redis Monitoring Metrics You Must Watch

Scalegrid

You will need to know which monitoring metrics for Redis to watch and a tool to monitor these critical server metrics to ensure its health. Redis returns a big list of database metrics when you run the info command on the Redis shell. You can pick a smart selection of relevant metrics from these.

Metrics 130
Insiders

Sign Up for our Newsletter

This site is protected by reCAPTCHA and the Google Privacy Policy and Terms of Service apply.

Trending Sources

article thumbnail

AI-driven analysis of Spring Micrometer metrics in context, with topology at scale

Dynatrace

Micrometer is used for instrumenting both out-of-the-box and custom metrics from Spring Boot applications. Since Micrometer conforms data to the right form and then sends it off for analysis, companies need an easy way to analyze massive amounts of data , get actionable insights in real time, and interpret the resulting alerts and responses.

Metrics 130
article thumbnail

AI-driven analysis of Spring Micrometer metrics in context, with topology at scale

Dynatrace

Micrometer is used for instrumenting both out-of-the-box and custom metrics from Spring Boot applications. Since Micrometer conforms data to the right form and then sends it off for analysis, companies need an easy way to analyze massive amounts of data , get actionable insights in real time, and interpret the resulting alerts and responses.

Metrics 130
article thumbnail

Best practices and key metrics for improving mobile app performance

Dynatrace

As a result, organizations need to monitor mobile app performance metrics that are meaningful and actionable by gaining adequate observability of mobile app performance. There are many common mobile app performance metrics that are used to measure key performance indicators (KPIs) related to user experience and satisfaction.

article thumbnail

Seeing through hardware counters: a journey to threefold performance increase

The Netflix TechBlog

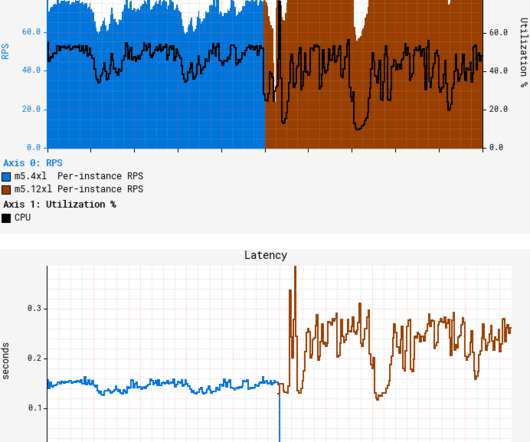
A quick canary test was free of errors and showed lower latency, which is expected given that our standard canary setup routes an equal amount of traffic to both the baseline running on 4xl and the canary on 12xl. What’s worse, average latency degraded by more than 50%, with both CPU and latency patterns becoming more “choppy.”

Hardware 363
article thumbnail

Migrating Critical Traffic At Scale with No Downtime?—?Part 1

The Netflix TechBlog

The second phase involves migrating the traffic over to the new systems in a manner that mitigates the risk of incidents while continually monitoring and confirming that we are meeting crucial metrics tracked at multiple levels. It provides a good read on the availability and latency ranges under different production conditions.

Traffic 339