Remove Grafana
article thumbnail

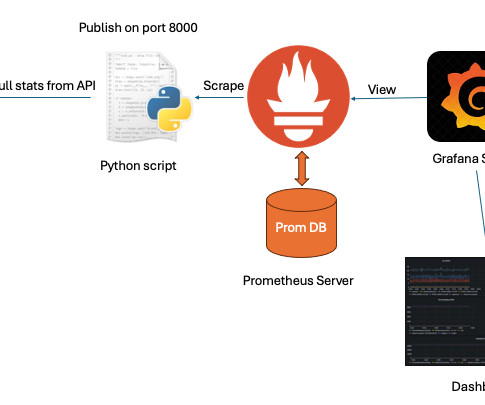
Achieving Kubernetes Monitoring Nirvana: Prometheus and Grafana Unleashed

DZone

This is where Prometheus and Grafana step in, forming a dynamic duo that provides comprehensive insights into Kubernetes clusters. In the ever-evolving landscape of container orchestration, Kubernetes has emerged as a frontrunner, offering unparalleled flexibility and scalability.

article thumbnail

Introduction to Grafana, Prometheus, and Zabbix

DZone

What Is Grafana? Grafana is an open-source tool to visualize the metrics and logs from different data sources. The metrics can be stored in various DBs, and Grafana supports most of them, like Prometheus , Zabbix, Graphite, MySQL, PostgreSQL, Elasticsearch, etc. Various platforms that are supported by Grafana today:

Big Data 161
Insiders

Sign Up for our Newsletter

This site is protected by reCAPTCHA and the Google Privacy Policy and Terms of Service apply.

Trending Sources

article thumbnail

Prometheus AWS Exporter and Grafana

DZone

The main purpose of this article and use case is to scrape AWS CloudWatch metrics into the Prometheus time series and to visualize the metrics data in Grafana. Prometheus and Grafana are the most powerful, robust open-source tools for monitoring, collecting, visualizing, and performance metrics of the deployed applications in production.

AWS 256
article thumbnail

Elevate Your Security Posture: Grafana for Real-Time Security Analytics and Alerts

DZone

Grafana, a leading open-source platform for monitoring and observability, has emerged as a critical player in enhancing security postures through real-time security analytics and alerts. This article delves into how Grafana can be leveraged to bolster your security defenses, offering step-by-step guidance and practical code snippets.

Analytics 161
article thumbnail

Visualizing IoT Data With MQTT, QuestDB, and Grafana

DZone

To visualize the results, we will connect Grafana to QuestDB using its Postgres interface. The data is sent to an MQTT-compatible message broker called Mosquitto, and then channeled to QuestDB through Telegraf, a highly efficient data collector.

IoT 241
article thumbnail

Using Prometheus and Grafana to monitor a Nutanix Cluster.

n0derunner

Using a small python script we can liberate data from the “Analysis” page of prism element and send it to prometheus, where we can combine cluster metrics with other data and view them all on some nice Grafana dashboards. appeared first on n0derunner.

article thumbnail

Deploying Prometheus and Grafana as Applications using ArgoCD?—?Including Dashboards

DZone

This post will teach you how to easily install and manage infrastructure services like Prometheus and Grafana with ArgoCD. Say goodbye to the headaches of manual infrastructure management and hello to a more efficient and scalable approach with ArgoCD!