Remove 2018 Remove Benchmarking Remove Latency Remove Network
article thumbnail

How to use Server Timing to get backend transparency from your CDN

Speed Curve

Looking at the industry benchmarks for US retailers , four well-known sites have backend times that are approaching – or well beyond – that threshold. Pagespeed Benchmarks - US Retail - LCP When you examine a waterfall, it's pretty obvious that TTFB is the long pole in the tent, pushing out render times for the page.

Servers 57
article thumbnail

Kubernetes for Big Data Workloads

Abhishek Tiwari

In 2018, a widespread adaptation of Kubernetes for big data processing is anitcipated. optimised container networking and security. direct access to raw block storage [18] without the abstraction of a filesystem for workloads that require consistent I/O performance and low latency. overall performance comparable to bare metal.

Insiders

Sign Up for our Newsletter

This site is protected by reCAPTCHA and the Google Privacy Policy and Terms of Service apply.

Trending Sources

article thumbnail

Fixing a slow site iteratively

CSS - Tricks

Google’s industry benchmarks from 2018 also provide a striking breakdown of how each second of loading affects bounce rates. Source: Google /SOASTA Research, 2018. Using a network request inspector, I’m going to see if there’s anything we can remove via the Network panel in DevTools.

Cache 92
article thumbnail

The Performance Inequality Gap, 2024

Alex Russell

It's time once again to update our priors regarding the global device and network situation. seconds on the target device and network profile, consuming 120KiB of critical path resources to become interactive, only 8KiB of which is script. What's changed since last year? and 75KiB of JavaScript. These are generous targets.

article thumbnail

Progress Delayed Is Progress Denied

Alex Russell

As an engineer on a browser team, I'm privy to the blow-by-blow of various performance projects, benchmark fire drills, and the ways performance marketing (deeply) impacts engineering priorities. With each team, benchmarks lost are understood as bugs. April 2018 , but not usable until several releases later). Delayed five years.

Media 145
article thumbnail

The Performance Inequality Gap, 2021

Alex Russell

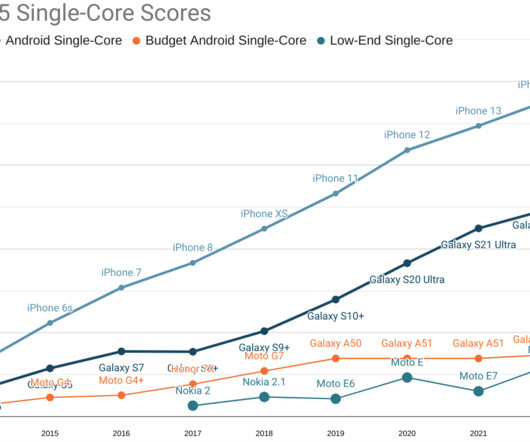
Thanks to progress in networks and browsers (but not devices), a more generous global budget cap has emerged for sites constructed the "modern" way: ~100KiB of HTML/CSS/fonts and ~300-350KiB of JS (compressed) is the new rule-of-thumb limit for at least the next year or two. Modern network performance and availability.

article thumbnail

Can You Afford It?: Real-world Web Performance Budgets

Alex Russell

We constrain ourselves to a real-world baseline device + network configuration to measure progress. Budgets are scaled to a benchmark network & device. JavaScript is the single most expensive part of any page in ways that are a function of both network capacity and device speed. The median user is on a slow network.