Remove 2015 Remove Cloud Remove Development Remove Latency
article thumbnail

Observability platform vs. observability tools

Dynatrace

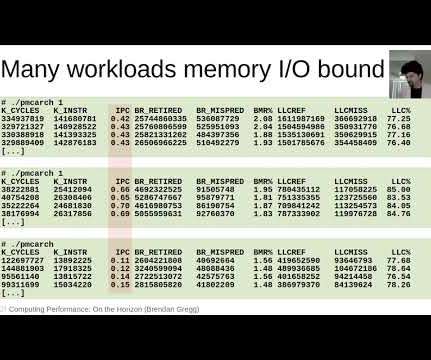
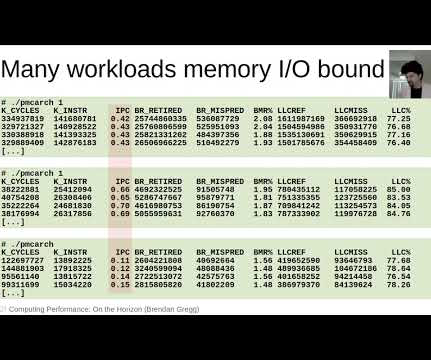
Observability gives developers and system operators real-time awareness of a highly distributed system’s current state based on the data it generates. Metrics are measures of critical system values, such as CPU utilization or average write latency to persistent storage. What is observability?

article thumbnail

USENIX LISA2021 Computing Performance: On the Horizon

Brendan Gregg

It's an exciting time for developments in computer performance, not just for the BPF technology (which I often [write about]) but also for processors with 3D stacking and cloud vendor CPUs (e.g., Ford, et al., “TCP

Insiders

Sign Up for our Newsletter

This site is protected by reCAPTCHA and the Google Privacy Policy and Terms of Service apply.

Trending Sources

article thumbnail

USENIX SREcon APAC 2022: Computing Performance: What's on the Horizon

Brendan Gregg

At USENIX SREcon22 APAC I gave the opening keynote on the future of computer performance, rounding up the latest developments and making predictions of where I see things heading. This talk originated from my updates to [Systems Performance 2nd Edition], and this was the first time I've given this talk in person! Ford, et al., “TCP

article thumbnail

What Adrian Did Next: 2022 Conference Appearances

Adrian Cockcroft

photo by Adrian I gave a talk at Monitorama in Portland Oregon in June, which set out the idea that carbon is just another metric to monitor, and that in a few years most of the monitoring and performance tuning tools are going to be reporting and optimizing for carbon alongside latency, throughput, availability and cost.

AWS 52
article thumbnail

USENIX SREcon APAC 2022: Computing Performance: What's on the Horizon

Brendan Gregg

At USENIX SREcon22 APAC I gave the opening keynote on the future of computer performance, rounding up the latest developments and making predictions of where I see things heading. This talk originated from my updates to Systems Performance 2nd Edition , and this was the first time I've given this talk in person! Ford, et al., “TCP

article thumbnail

USENIX LISA2021 Computing Performance: On the Horizon

Brendan Gregg

It's an exciting time for developments in computer performance, not just for the BPF technology (which I often [write about]) but also for processors with 3D stacking and cloud vendor CPUs (e.g., Ford, et al., “TCP

article thumbnail

How To Add eBPF Observability To Your Product

Brendan Gregg

biolatency Disk I/O latency histogram heat map. runqlat CPU scheduler latency heat map. This is currently part of our FlameCommander UI, which also runs flame graphs across the cloud. For a more recent example, I wrote cachestat(8) while on vacation in 2014 for use on the Netflix cloud, which was a mix of Linux 3.2

Latency 145