Remove Network Remove Operating System Remove Servers Remove Tuning
article thumbnail

Crucial Redis Monitoring Metrics You Must Watch

Scalegrid

You will need to know which monitoring metrics for Redis to watch and a tool to monitor these critical server metrics to ensure its health. Connected_slaves provides information about replication status while Used_memory tracks utilized amount of server’s total capacity. You can pick a smart selection of relevant metrics from these.

Metrics 130
article thumbnail

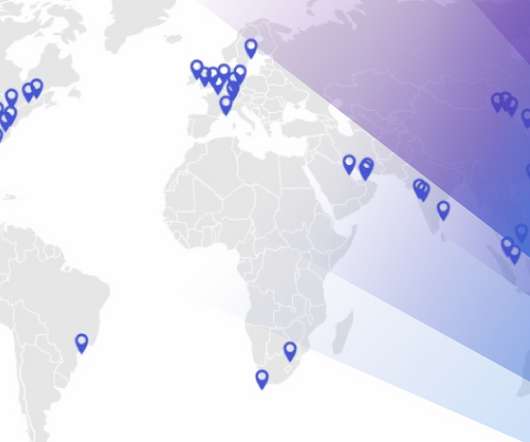
Private Synthetic Monitoring locations now also supported on Ubuntu 20

Dynatrace

But what if you want to monitor internal applications that aren’t available publicly but are only accessible within your corporate network? You can deploy private Synthetic locations at various points within your company network and then execute monitors from them. Try it out for yourself. What’s next. …and much more!

Insiders

Sign Up for our Newsletter

This site is protected by reCAPTCHA and the Google Privacy Policy and Terms of Service apply.

Trending Sources

article thumbnail

How digital experience monitoring helps deliver business observability

Dynatrace

With DEM solutions, organizations can operate over on-premise network infrastructure or private or public cloud SaaS or IaaS offerings. It is proactive monitoring that simulates traffic with established test variables, including location, browser, network, and device type. One of the key advantages of DEM is its versatility.

article thumbnail

How to Assess MySQL Performance

HammerDB

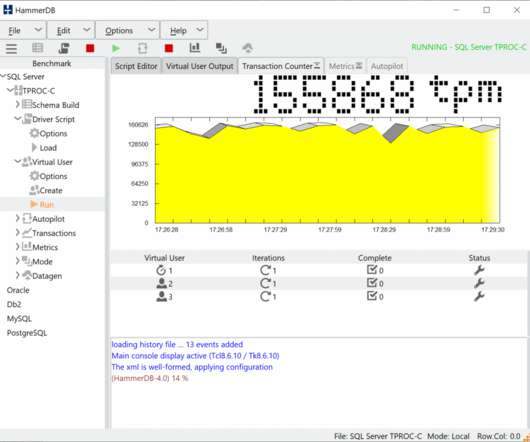
Therefore, before we attempt to measure our database performance, we should know the system or cloud instance to be tested in detail. This allows us to know our operating environment and its capability. Operating System: Ubuntu 22.04 For the experiments in this blog, we did not tune the system. 4.22 %usr 38.40

article thumbnail

What Adrian Did Next?—?Part 2?—?Sun Microsystems

Adrian Cockcroft

The early days at Sun Cambridge were special, I absorbed a lot about networking and the technical side of the role from my fellow systems engineer Martin Baines, and we were driving all over the region in cool company cars (I had a Citroen BX 16V) selling a really hot product.

Tuning 52
article thumbnail

Error Tracking - Top Suggestions and Tools

KeyCDN

Back-End Error Tracking Back-end, or server-side, errors include things like page exceptions and JavaScript errors. Not all back-end errors affect the user experience, but keeping track of them can prove helpful when tuning your app. While lastly, APM allows you to gather data on server-side bottlenecks.

article thumbnail

The road to observability demo part 3: Collect, instrument, and analyze telemetry data automatically with Dynatrace

Dynatrace

Think about items such as general system metrics (for example, CPU utilization, free memory, number of services), the connectivity status, details of our web server, or even more granular in-application tasks like database queries. Let’s click “Apache Web Server apache” now.

Metrics 171