Remove Java Remove Metrics Remove Scalability Remove Speed
article thumbnail

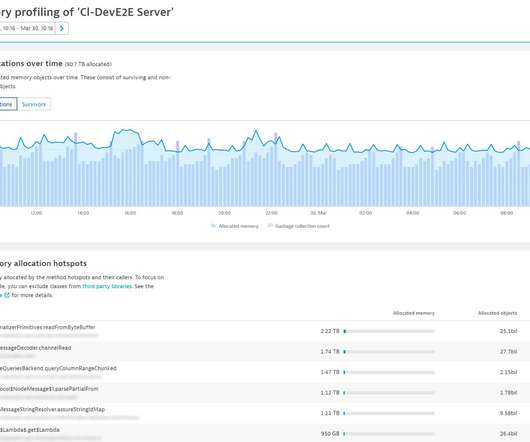
Radically speed up your code by fixing slow or frequent garbage collection

Dynatrace

Java Memory Management, with its built-in garbage collection, is one of the language’s finest achievements. However, garbage collection is one of the main sources of performance and scalability issues in any modern Java application. Any significant reduction in allocations will inevitably speed up your code.

Speed 164
article thumbnail

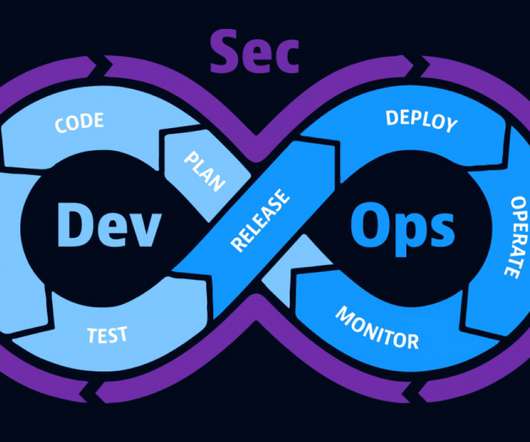
DevOps observability: A guide for DevOps and DevSecOps teams

Dynatrace

However, getting reliable answers from observability data so teams can automate more processes to ensure speed, quality, and reliability can be challenging. This drive for speed has a cost: 22% of leaders admit they’re under so much pressure to innovate faster that they must sacrifice code quality.

DevOps 187
Insiders

Sign Up for our Newsletter

This site is protected by reCAPTCHA and the Google Privacy Policy and Terms of Service apply.

Trending Sources

article thumbnail

InfoSec 2022 guide: How DevSecOps practices drive organizational resilience

Dynatrace

But with this speed, agility, and innovation come new challenges. Adopting cloud-native technologies and open source software makes applications more feature rich and scalable, but it also increases IT complexity. Spring4Shell: Detect and mitigate new zero-day vulnerabilities in the Java Spring Framework – blog.

article thumbnail

Dynatrace launches automatic end-to-end observability via traces for AWS Lambda (Preview program)

Dynatrace

Serverless functions extend applications to accelerate speed of innovation. Although the adoption of serverless functions brings many benefits, including scalability, quick deployments, and updates, it also introduces visibility and monitoring challenges to CloudOps and DevOps. Improved mapping and topology detection.

Lambda 283
article thumbnail

The road to observability demo part 3: Collect, instrument, and analyze telemetry data automatically with Dynatrace

Dynatrace

Making applications observable—relying on metrics, logs, and traces to understand what software is doing and how it’s performing—has become increasingly important as workloads are shifting to multicloud environments. We also introduced our demo app and explained how to define the metrics and traces it uses.

Metrics 163
article thumbnail

Sponsored Post: InMemory.Net, Triplebyte, Etleap, Stream, Scalyr

High Scalability

Client libraries are available for Node, Ruby, Python, PHP, Go, Java and.NET. Get visibility into your production issues without juggling multiple tabs and different services -- all of your logs, server metrics and alerts are in your browser and at your fingertips. Try the API now in this 5 minute interactive tutorial.

Java 137
article thumbnail

Sponsored Post: InMemory.Net, Triplebyte, Etleap, Stream, Scalyr

High Scalability

Client libraries are available for Node, Ruby, Python, PHP, Go, Java and.NET. Get visibility into your production issues without juggling multiple tabs and different services -- all of your logs, server metrics and alerts are in your browser and at your fingertips. Try the API now in this 5 minute interactive tutorial.

Java 125