article thumbnail

Extract metrics from business events to increase the value of business analytics

Dynatrace

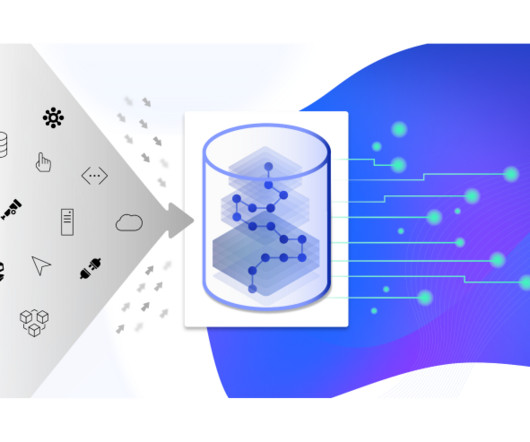
This is achieved, in part, by establishing actionable statistical accuracy —not necessarily precise accuracy —through practical levels of metric sampling, aggregation, and extrapolation. To close these critical gaps, Dynatrace has defined a new class of events called business events.

Analytics 190
article thumbnail

Extend business observability: Extract business events from online databases (Part 2)

Dynatrace

In part 2, we’ll show you how to retrieve business data from a database, analyze that data using dashboards and ad hoc queries, and then use a Davis analyzer to predict metric behavior and detect behavioral anomalies. Dynatrace users typically use extensions to pull technical monitoring data, such as device metrics, into Dynatrace.

Database 259
Insiders

Sign Up for our Newsletter

This site is protected by reCAPTCHA and the Google Privacy Policy and Terms of Service apply.

Trending Sources

article thumbnail

The value of business events: How IT can increase business agility

Dynatrace

Business events are a special class of events, new to Business Analytics; together with Grail, our data lakehouse, they provide the precision and advanced analytics capabilities required by your most important business use cases. What are business events? This diagram shows a few examples of business events.

Analytics 217
article thumbnail

Observability engineering: Getting Prometheus metrics right for Kubernetes with Dynatrace and Kepler

Dynatrace

To get a more granular look into telemetry data, many analysts rely on custom metrics using Prometheus. Named after the Greek god who brought fire down from Mount Olympus, Prometheus metrics have been transforming observability since the project’s inception in 2012.

Metrics 169
article thumbnail

Intelligent, context-aware AI analytics for all your custom metrics

Dynatrace

Dynatrace recently opened up the enterprise-grade functionalities of Dynatrace OneAgent to all the data needed for observability, including metrics, events, logs, traces, and topology data. Davis topology-aware anomaly detection and alerting for your custom metrics. Topology and non-topology metrics—what’s the difference?

Metrics 242
article thumbnail

Connect Fluentd logs with Dynatrace traces, metrics, and topology data to enhance Kubernetes observability

Dynatrace

Output plugins deliver logs to storage solutions, analytics tools, and observability platforms like Dynatrace. While Fluentd solves the challenges of collecting and normalizing Kubernetes events and logs, Kubernetes performance and availability problems can rarely be solved by investigating logs in isolation.

Metrics 170
article thumbnail

How Red Hat and Dynatrace intelligently automate your production environment

Dynatrace

Red Hat and Dynatrace integration overview The strategic partnership and integration between Red Hat and Dynatrace are game changers that solve each mentioned pain point: Easily ingest (and gain precise insights into) your logs, metrics, traces, and business data. In-context topology identification.

DevOps 275