article thumbnail

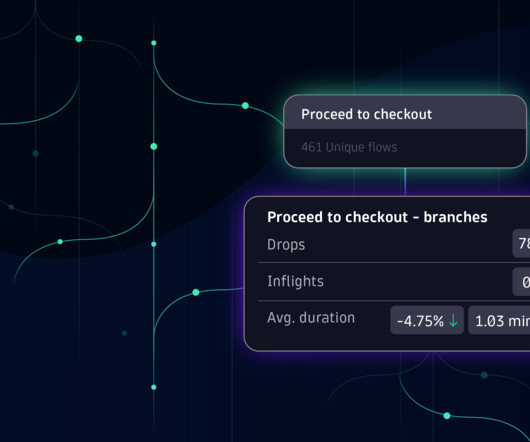
Business Flow: Why IT operations teams should monitor business processes

Dynatrace

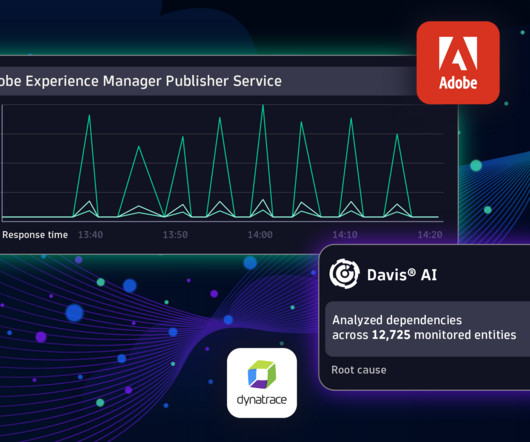
Most business processes are not monitored. Business processes can be quite complex, often including conditional branches and loops; many business process monitoring initiatives are abandoned or simplified after attempting to map the process flow. First and foremost, it’s a data problem. A step may have up to five branches.

article thumbnail

Citrix monitoring with Dynatrace: Easily observe your entire Citrix ecosystem

Dynatrace

Automated AI-powered analytics are necessary to match the scale of monitoring these enterprises require. Our journey began in 2019 with the introduction of the Dynatrace Citrix monitoring extension. Listen, learn, improve, and repeat The latest update to the Citrix monitoring extension is now available.

Insiders

Sign Up for our Newsletter

This site is protected by reCAPTCHA and the Google Privacy Policy and Terms of Service apply.

Trending Sources

article thumbnail

Practical business process monitoring for real-time business observability

Dynatrace

One of the more popular use cases is monitoring business processes, the structured steps that produce a product or service designed to fulfill organizational objectives. By treating processes as assets with measurable key performance indicators (KPIs), business process monitoring helps IT and business teams align toward shared business goals.

article thumbnail

Percona Operators Custom Resource Monitoring With Kube-state-metrics

Percona

With Percona Operators , users can easily deploy, monitor, and manage databases orchestrated by Kubernetes, making it easier and more efficient to run databases at scale. Our Operators come with Custom Resources that have their own statuses and fields to ease monitoring and troubleshooting. Once captured, the metrics are exposed.

Metrics 68
article thumbnail

AI-driven analysis of Spring Micrometer metrics in context, with typology at scale

Dynatrace

Micrometer is used for instrumenting both out-of-the-box and custom metrics from Spring Boot applications. Davis topology-aware anomaly detection and alerting for your Micrometer metrics. Topology-related custom metrics for seamless reports and alerts. Micrometer uses a registry to export metrics to monitoring systems.

Metrics 213
article thumbnail

Transform log data into actionable metrics and have Davis AI do the work for you

Dynatrace

Over the last year, Dynatrace extended its AI-powered log monitoring capabilities by providing support for all log data sources. We added monitoring and analytics for log streams from Kubernetes and multicloud platforms like AWS, GCP, and Azure, as well as the most widely used open-source log data frameworks.

Metrics 220
article thumbnail

How to collect Prometheus metrics in Dynatrace

Dynatrace

Dynatrace has recently extended its Kubernetes operator by adding a new feature, the Prometheus OpenMetrics Ingest , which enables you to import Prometheus metrics in Dynatrace and build SLO and anomaly detection dashboards with Prometheus data. Here we’ll explore how to collect Prometheus metrics and what you can achieve with them.

Metrics 206