article thumbnail

Application observability meets developer observability: Unlock a 360º view of your environment

Dynatrace

With topics ranging from best practices to cloud cost management and success stories, the conference will be a valuable resource for understanding observability and getting started. Dynatrace enables teams to specify SLOs, such as latency, uptime, availability, and more. and bring that to you while your program continues to run.”

article thumbnail

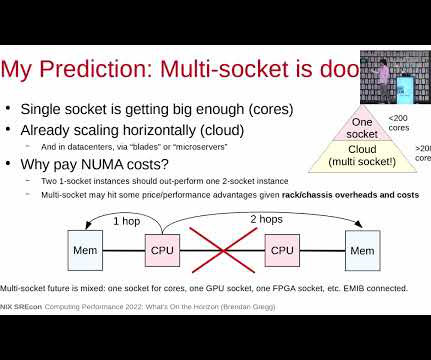
USENIX SREcon APAC 2022: Computing Performance: What's on the Horizon

Brendan Gregg

My personal opinion is that I don't see a widespread need for more capacity given horizontal scaling and servers that can already exceed 1 Tbyte of DRAM; bandwidth is also helpful, but I'd be concerned about the increased latency for adding a hop to more memory. Or even on a plane.

Insiders

Sign Up for our Newsletter

This site is protected by reCAPTCHA and the Google Privacy Policy and Terms of Service apply.

Trending Sources

article thumbnail

USENIX SREcon APAC 2022: Computing Performance: What's on the Horizon

Brendan Gregg

My personal opinion is that I don't see a widespread need for more capacity given horizontal scaling and servers that can already exceed 1 Tbyte of DRAM; bandwidth is also helpful, but I'd be concerned about the increased latency for adding a hop to more memory. Or even on a plane. It was a great privilege.

article thumbnail

Current status, needs, and challenges in Heterogeneous and Composable Memory from the HCM workshop (HPCA’23)

ACM Sigarch

using Compute Express Link or CXL), organizing memory components for optimal performance, adapting system software traditionally designed for homogeneous memory systems, and developing memory abstractions and programming constructs for HCM management. Figure 2: Latency characteristics of memory technologies (source: Maruf et al.,

Latency 52
article thumbnail

A thorough introduction to bpftrace

Brendan Gregg

For example, iostat(1), or a monitoring agent, may tell you your average disk latency, but not the distribution of this latency. For smaller environments, it can be of more use helping eliminate latency outliers. The probe is BEGIN , a special probe that runs at the beginning of the program (like awk). was just released.

Latency 68
article thumbnail

How To Add eBPF Observability To Your Product

Brendan Gregg

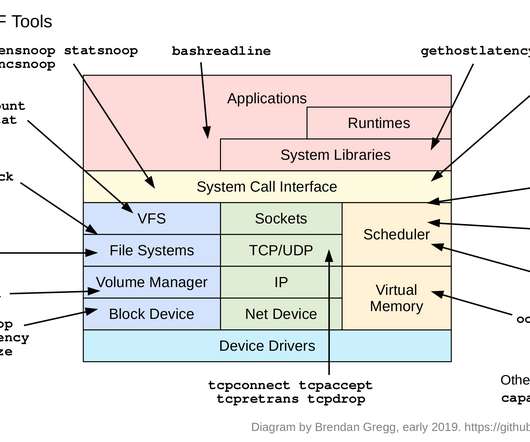
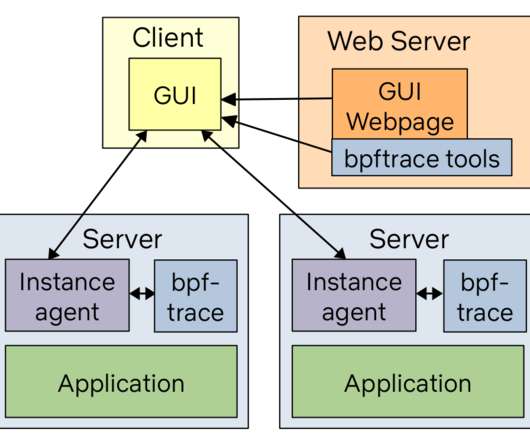
biolatency Disk I/O latency histogram heat map. runqlat CPU scheduler latency heat map. I see people think like a programmer instead and feel they must start by learning bcc and BPF programming in depth. execsnoop New processes (via exec(2)) table. opensnoop Files opened table. ext4slower Slow filesystem I/O table.

Latency 145
article thumbnail

How To Add eBPF Observability To Your Product

Brendan Gregg

biolatency Disk I/O latency histogram heat map 5. runqlat CPU scheduler latency heat map 10. I see people think like a programmer instead and feel they must start by learning bcc and BPF programming in depth. execsnoop New processes (via exec(2)) table 2. opensnoop Files opened table 3. ext4slower Slow filesystem I/O table 4.