Remove Comparison Remove Performance Remove Speed Remove Traffic
article thumbnail

2023 Black Friday and Cyber Monday retail and e-commerce IT performance observations

Dynatrace

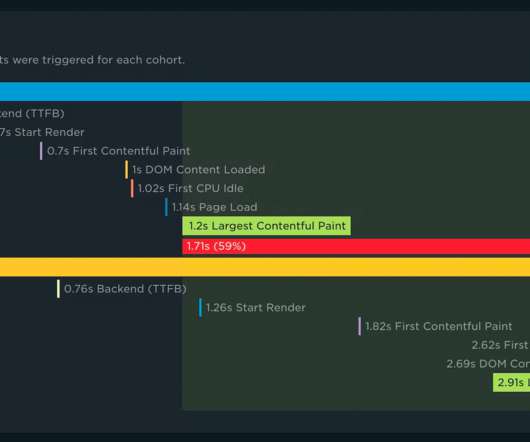
Over the years, I have watched and written about online retail and e-commerce IT performance. What was once an onslaught of consumer traffic between Black Friday and Cyber Monday has turned into a weeklong event, with most retailers offering deals well ahead of Black Friday. This is where many retailers have matured over the years.

Retail 217
article thumbnail

Running A Page Speed Test: Monitoring vs. Measuring

Smashing Magazine

Running A Page Speed Test: Monitoring vs. Measuring Running A Page Speed Test: Monitoring vs. Measuring Geoff Graham 2023-08-10T08:00:00+00:00 2023-08-10T12:35:05+00:00 This article is sponsored by DebugBear There is no shortage of ways to measure the speed of a webpage. Not the best way to get a high-level view of performance.

Speed 81
Insiders

Sign Up for our Newsletter

This site is protected by reCAPTCHA and the Google Privacy Policy and Terms of Service apply.

Trending Sources

article thumbnail

Redis vs Memcached in 2024

Scalegrid

In this comparison of Redis vs Memcached, we strip away the complexity, focusing on each in-memory data store’s performance, scalability, and unique features. Redis and Memcached both provide high performance with sub-millisecond response times. Managed DBaaS solutions like ScaleGrid.io

Cache 130
article thumbnail

Automated Change Impact Analysis with Site Reliability Guardian

Dynatrace

SREs use Service-Level Indicators (SLI) to see the complete picture of service availability, latency, performance, and capacity across various systems, especially revenue-critical systems. Thus, Site Reliability Guardian supports DevOps and SREs in speeding up release delivery and improving release quality.

DevOps 215
article thumbnail

The Speed of Time

Brendan Gregg

These strange questions came to the fore back in 2014 when Netflix was switching services from CentOS Linux to Ubuntu, and I helped debug several weird performance issues including one I'll describe here. A quick check of basic performance statistics showed over 30% higher CPU consumption. How would you _time_ time?

Speed 126
article thumbnail

New SNMP platform extensions provide observability at scale for network devices

Dynatrace

To help you speed up MTTR, there are several levels of visualization to help slice and dice through information: Instances. The built-in unified analysis pages offer real-time comparison of key performance indicators while applying a topology-first approach to the data. Pool nodes. Virtual servers. Interfaces.

Network 207
article thumbnail

NEW! RUM Compare dashboard

Speed Curve

With your RUM Compare dashboard, you can easily generate side-by-side comparisons for any two cohorts of data. Triage a performance regression related to the latest change or deployment to your site by looking at a before/after comparison. Evaluate CDN performance by exploring the impact of time-of-day traffic patterns.

Traffic 54