Remove Code Remove Course Remove Database Remove Java
article thumbnail

Progressive delivery at cloud scale: Optimizing CPU intensive code with Dynatrace

Dynatrace

And the code-level root cause information is what makes troubleshooting easy for developers. As Dynatrace automatically captures stack traces for all threads at all time the CPU Hotspot analysis makes it easy to identify which code is consuming all that CPU in that particular thread. Step 3: Identifying root-cause in code.

Code 241
article thumbnail

Dynatrace Application Security detects and blocks attacks automatically in real-time

Dynatrace

They are part of continuous delivery pipelines and examine code to find vulnerabilities. There is another critical element that needs to be addressed: how do you protect applications against attacks exploiting vulnerabilities while DevSecOps teams simultaneously try to resolve those issues in the code ? How to get started.

Traffic 231
Insiders

Sign Up for our Newsletter

This site is protected by reCAPTCHA and the Google Privacy Policy and Terms of Service apply.

Trending Sources

article thumbnail

The road to observability demo part 3: Collect, instrument, and analyze telemetry data automatically with Dynatrace

Dynatrace

However, this method limited us to instrumenting the code manually and collecting specific sets of data we defined upfront. The beauty of OneAgent is it’s a drop-in solution and monitors every supported technology (for example,NET, Java, PHP, Node.js) with little to no manual work required from your side.

Metrics 168
article thumbnail

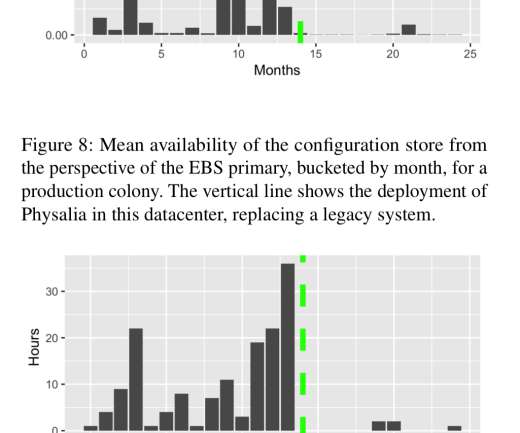
Millions of tiny databases

The Morning Paper

Millions of tiny databases , Brooker et al., It takes you through the thinking processes and engineering practices behind the design of a key part of the control plane for AWS Elastic Block Storage (EBS): the Physalia database that stores configuration information. NSDI’20. This paper is a real joy to read. Physalia in the large.

Database 106
article thumbnail

Announcing enterprise-grade observability at scale for your OpenTelemetry custom metrics

Dynatrace

To ensure observability, the open source CNCF project OpenTelemetry aims at providing a standardized, vendor-neutral way of pre-instrumenting libraries and platforms and annotating UserLAnd code. Getting specific metrics from libraries that are pre-instrumented with OpenTelemetry (for example, database drivers).
Metrics 150
article thumbnail

Sponsored Post: Close, Wynter, Pinecone, Kinsta, Bridgecrew, IP2Location, StackHawk, InterviewCamp.io, Educative, Stream, Fauna, Triplebyte

High Scalability

If you have a passion for databases (both SQL and NoSQL), significant experience building, managing, and monitoring infrastructure, databases, and backend services at scale and want to work with a rag-tag team of hardworking, but humble humans, then come check us out! Make your job search O (1), not O ( n ). Apply here.

Education 100
article thumbnail

Sponsored Post: G-Core Labs, Close, Wynter, Pinecone, Kinsta, Bridgecrew, IP2Location, StackHawk, InterviewCamp.io, Educative, Stream, Fauna, Triplebyte

High Scalability

If you have a passion for databases (both SQL and NoSQL), significant experience building, managing, and monitoring infrastructure, databases, and backend services at scale and want to work with a rag-tag team of hardworking, but humble humans, then come check us out! Learn more here. Search like you mean it. Get started for free!

Education 100