
How to Estimate Web Performance Impact Before Making Fixes
Jos
MARCH 13, 2020
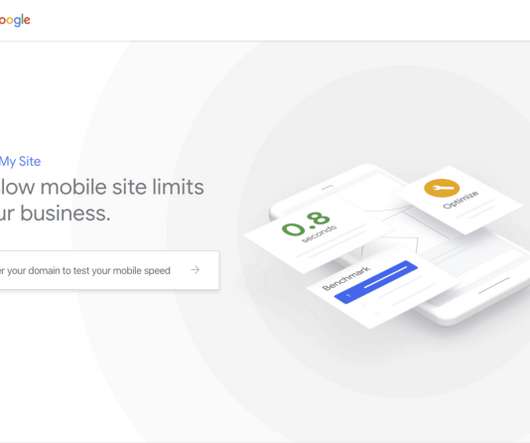
Look, there are many case studies proving a correlation between loading time and business metrics!” ?-?I Using Test My Site from Think with Google : Gives you an estimation of potential revenue increase for your site when saving loading time. What is the business opportunity for web performance improvements?


Let's personalize your content