Remove Benchmarking Remove Latency Remove Mobile Remove Network
article thumbnail

Redis vs Memcached in 2024

Scalegrid

Benchmarking Cache Speed Memcached is optimized for high read and write loads, making it highly efficient for rapid data access in a basic key-value store. Redis’s support for pipelining in a Redis server can significantly reduce network latency by batching command executions, making it beneficial for write-heavy applications.

Cache 130
article thumbnail

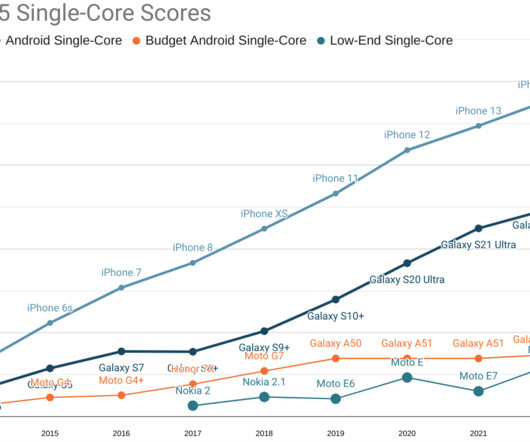
The Performance Inequality Gap, 2024

Alex Russell

It's time once again to update our priors regarding the global device and network situation. seconds on the target device and network profile, consuming 120KiB of critical path resources to become interactive, only 8KiB of which is script. What's changed since last year? and 75KiB of JavaScript. These are generous targets.

Insiders

Sign Up for our Newsletter

This site is protected by reCAPTCHA and the Google Privacy Policy and Terms of Service apply.

Trending Sources

article thumbnail

What Is a Workload in Cloud Computing

Scalegrid

This is sometimes referred to as using an “over-cloud” model that involves a centrally managed resource pool that spans all parts of a connected global network with internal connections between regional borders, such as two instances in IAD-ORD for NYC-JS webpage DNS routing. This also aids scalability down the line.

Cloud 130
article thumbnail

The Performance Inequality Gap, 2021

Alex Russell

Thanks to progress in networks and browsers (but not devices), a more generous global budget cap has emerged for sites constructed the "modern" way: ~100KiB of HTML/CSS/fonts and ~300-350KiB of JS (compressed) is the new rule-of-thumb limit for at least the next year or two. Modern network performance and availability.

article thumbnail

Five Data-Loading Patterns To Improve Frontend Performance

Smashing Magazine

The resource loading waterfall is a cascade of files downloaded from the network server to the client to load your website from start to finish. It essentially describes the lifetime of each file you download to load your page from the network. You can see this by opening your browser and looking in the Networking tab.

article thumbnail

Fixing a slow site iteratively

CSS - Tricks

Google’s industry benchmarks from 2018 also provide a striking breakdown of how each second of loading affects bounce rates. Speed is also something Google considers when ranking your website placement on mobile. Using a network request inspector, I’m going to see if there’s anything we can remove via the Network panel in DevTools.

Cache 92
article thumbnail

Can You Afford It?: Real-world Web Performance Budgets

Alex Russell

We constrain ourselves to a real-world baseline device + network configuration to measure progress. Budgets are scaled to a benchmark network & device. media="(min-width: 750px)"> <img srcset="img@mobile.png, img@mobile-2x.png 2x". Deciding what benchmark to use for a performance budget is crucial.