article thumbnail

New web performance insights with additional metrics and enhanced Visually complete for synthetic monitors

Dynatrace

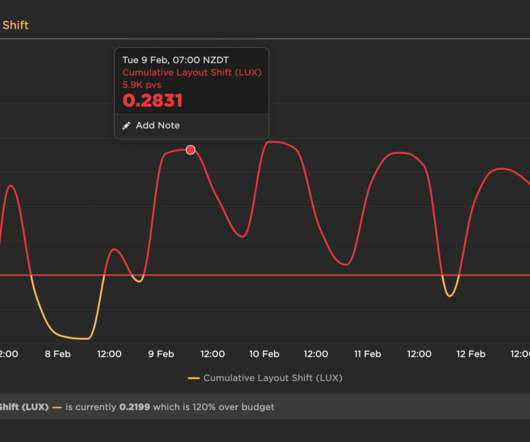
Dynatrace Synthetic Monitoring allows you to proactively monitor the availability of your public as well as your internal web applications and API endpoints from locations around the globe or important internal locations such as branch offices. Synthetic monitors help you find issues before they affect your customers.

Metrics 220
article thumbnail

What is infrastructure monitoring and why is it mission-critical in the new normal?

Dynatrace

This shift requires infrastructure monitoring to ensure all your components work together across applications, operating systems, storage, servers, virtualization, and more. What is infrastructure monitoring? . Dealing with an unstable website is stress that users don’t need, and definitely don’t want.

Insiders

Sign Up for our Newsletter

This site is protected by reCAPTCHA and the Google Privacy Policy and Terms of Service apply.

Trending Sources

article thumbnail

2023 Black Friday and Cyber Monday retail and e-commerce IT performance observations

Dynatrace

Social media was relatively quiet, and as always, the Dynatrace Insights team was benchmarking key retailer home pages from mobile and desktop perspectives. This type of issue would definitely affect conversion rates on a retail site. This year we saw few, if any, major issues with online retailers.

Retail 225
article thumbnail

How to evaluate modern APM solutions

Dynatrace

Application performance monitoring (APM) solutions have evolved in recent years, and organizations now have plenty of options to choose from when selecting the right tools for their needs. APM solutions track key software application performance metrics using monitoring software and telemetry data. Dynatrace news.

article thumbnail

Synthetic Monitoring vs. RUM

Rigor

Reading time 4 min It’s important for both technical and business teams to understand the different web performance monitoring options that are available as well as their various use cases and the benefits of each. Understanding Web Performance Monitoring Methodologies. Synthetic Monitoring. Real User Monitoring (RUM).

article thumbnail

An Opinionated Guide to Performance Budgets

Speed Curve

You can then configure your monitoring tools to send you alerts – or even break the build, if you're testing in your staging environment – when your budgets are violated. For each of these metrics, I've included what type of tool you can use to track them: synthetic and/or real user monitoring (RUM). Is it loading?

article thumbnail

Impact of Querying Table Information From information_schema

Percona

Disclaimer : This blog post is meant to show a less-known problem but is not meant to be a serious benchmark. This can also be seen using Percona Monitoring and Management (PMM) and checking the “MySQL overview” dashboard ->“MySQL table open cache status” graphic.

Cache 101