Remove Benchmarking Remove Cache Remove Example Remove Storage
article thumbnail

View from Nutanix storage during Postgres DB benchmark

n0derunner

In this example from prior post. Since the DB is small (50% the size of the Linux RAM) – the database is mostly cached on the read side – so we only see writes going to the DB files. The post View from Nutanix storage during Postgres DB benchmark appeared first on n0derunner.

article thumbnail

Crucial Redis Monitoring Metrics You Must Watch

Scalegrid

Key metrics like throughput, request latency, and memory utilization are essential for assessing Redis health, with tools like the MONITOR command and Redis-benchmark for latency and throughput analysis and MEMORY USAGE/STATS commands for evaluating memory. Cache Hit Ratio The cache hit ratio represents the efficiency of cache usage.

Metrics 130
Insiders

Sign Up for our Newsletter

This site is protected by reCAPTCHA and the Google Privacy Policy and Terms of Service apply.

Trending Sources

article thumbnail

How to Assess MySQL Performance

HammerDB

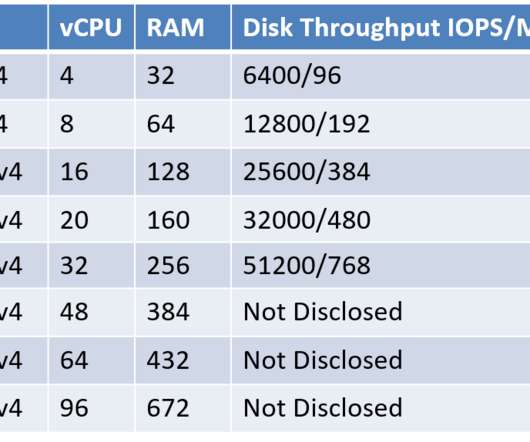
As database performance is heavily influenced by the performance of storage, network, memory, and processors, we must understand the upper limit of these key components. For example, if you are buying the latest Amazon memory-optimized EC2 instance (R7iz), the AWS page ( [link] ) tells us the following: Up to 3.9 4.22 %usr 38.40

article thumbnail

20X Faster Backup Preparation With Percona XtraBackup 8.0.33-28!

Percona

They are then applied (for example, writing old values back again) to the pages again and written to disk. After the “data dictionary” (DD) engine and DD cache are initialized on a server, the Storage Engines can ask for a table definition. Let’s take a look at the example table. CREATE TABLE test.t1(a

Cache 87
article thumbnail

A MyRocks Use Case

Percona

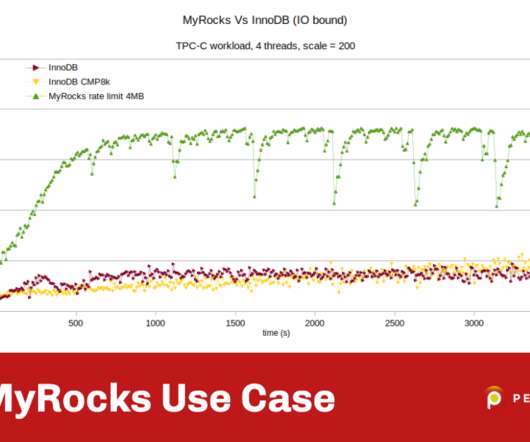
I wrote this post on MyRocks because I believe it is the most interesting new MySQL storage engine to have appeared over the last few years. The use case is the TPC-C benchmark but executed not on a high-end server but on a lower-spec virtual machine that is I/O limited like for example, with AWS EBS volumes. Conclusion.

Storage 55
article thumbnail

MySQL Key Performance Indicators (KPI) With PMM

Percona

Let’s dive in and learn how (and what) to effectively monitor MySQL performance, along with examples from PMM, by understanding the critical KPIs to watch for. This includes metrics such as query execution time, the number of queries executed per second, and the utilization of query cache and adaptive hash index.

article thumbnail

Five Data-Loading Patterns To Improve Frontend Performance

Smashing Magazine

On your first try, you can use it as a benchmark for optimizations later. Jamstack files usually use Markdown before being compiled to HTML, for example: author: Agustinus Theodorus title: ‘Title’ description: Description. Active Memory Caching. Caching partially stores your data and is not used as permanent storage.

Cache 125