Remove Availability Remove Java Remove Metrics Remove Servers
article thumbnail

Unmatched scalability and security of Dynatrace extensions now available for all supported technologies: 7 reasons to migrate your JMX and Python plugins

Dynatrace

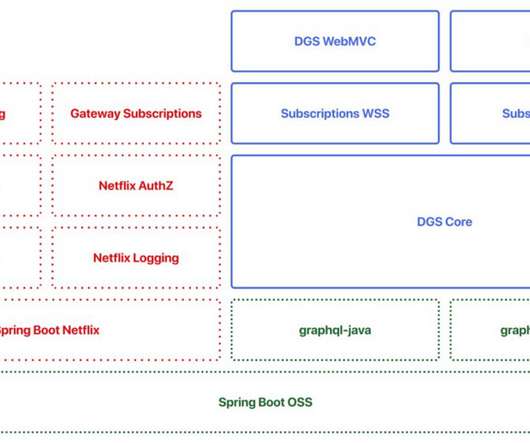
focused on technology coverage, building on the flexibility of JMX for Java and Python-based coded extensions for everything else. address these limitations and brings new monitoring and analytical capabilities that weren’t available to Extensions 1.0: Comprehensive metrics support Extensions 2.0 Dynatrace Extensions 1.0

article thumbnail

Automatic and intelligent end-to-end observability for OpenTelemetry Java

Dynatrace

Today, Dynatrace is happy to announce OneAgent support for discovering and automatically capturing OpenTelemetry trace data for Java. PurePath integrates OpenTelemetry Java data for enterprise-grade collection and contextual analytics. The world service uses the custom web server? Use-case example: WorldAtlas sample application.

Java 151
Insiders

Sign Up for our Newsletter

This site is protected by reCAPTCHA and the Google Privacy Policy and Terms of Service apply.

Trending Sources

article thumbnail

Unlock end-to-end observability insights with Dynatrace PurePath 4 seamless integration of OpenTracing for Java

Dynatrace

Dynatrace is fully committed to the OpenTelemetry community and to the seamless integration of OpenTelemetry data , including ingestion of custom metrics , into the Dynatrace open analytics platform. Find OpenTracing for Java seamlessly integrated into PurePath 4. ConcurrentMap<String, String> map = getTracingHazelcast().getMap("map");

Java 222
article thumbnail

The road to observability with OpenTelemetry demo part 1: Identifying metrics and traces

Dynatrace

That is, relying on metrics, logs, and traces to understand what software is doing and where it’s running into snags. When software runs in a monolithic stack on on-site servers, observability is manageable enough. In addition to tracing, observability also defines two other key concepts, metrics and logs.

Metrics 171
article thumbnail

Transform mainframe applications into z/OS Java services with end-to-end transaction visibility and anomaly detection (Preview)

Dynatrace

Although these COBOL applications operate with consistent performance, companies and governments are forced to transform them to new platforms and rewrite them in modern programming languages (like Java) for several reasons. Thus, implementing applications in Java can result in considerable financial savings.

Java 172
article thumbnail

Extend infrastructure observability with JMX Extensions and additional full-stack metrics

Dynatrace

To provide you with more value when monitoring hosts in infrastructure mode, we’re extending our infrastructure mode with a range of metrics that have until now only been available in full-stack mode. Monitor any infrastructure component and backing service that’s written in Java. Monitor additional metrics.

article thumbnail

Optimizing Java XPath CPU and memory overhead by 98%

Dynatrace

Solution : Use optimized methods to access / query for specific data, e.g.: getNodeByType resulted in 98% reduction of CPU usage, better performance, returned high availability and reduced operational costs. Perform an audit on default settings of the application server. Increase JVM memory limits to better handle spike load.

Java 211