Remove Availability Remove Course Remove Java Remove Performance
article thumbnail

Java memory optimizations: 3x Jenkins performance improvement with Dynatrace

Dynatrace

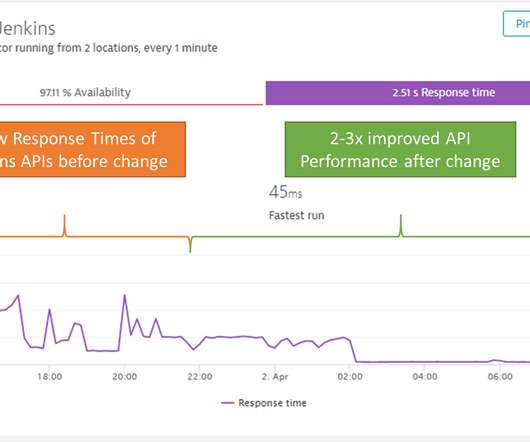
Dynatrace also alerted on intermittent outages throughout the day and especially after 8pm when the bulk of the nightly jobs were executed: On March 31st our Jenkins violated our SLAs from both availability and user experience. But let’s start from the beginning: Step #1 – Switching to Java 11.

Java 253
article thumbnail

Bending pause times to your will with Generational ZGC

The Netflix TechBlog

If you’re interested in how we use Java at Netflix, Paul Bakker’s talk How Netflix Really Uses Java , is a great place to start. Reference processing is also only performed in major collections with ZGC. Reduced tail latencies In both our GRPC and DGS Framework services, GC pauses are a significant source of tail latencies.

Latency 228
Insiders

Sign Up for our Newsletter

This site is protected by reCAPTCHA and the Google Privacy Policy and Terms of Service apply.

Trending Sources

article thumbnail

Top 20 Websites For Online Automation Testing Courses and Certifications

Testsigma

Certifications, typically, are proof of the enhanced prowess in the stream for which the course has been taken. Certifications and Courses help validate as well as enhance our technical capability in a specific vertical. A lot of these tools also need a fair amount of time to be invested in learning courses and doing certifications.

Website 53
article thumbnail

The Return of the Frame Pointers

Brendan Gregg

This technique saves two instructions in the prologue and epilogue and makes one additional general-purpose register (%rbp) available." I'm sure this delivered large performance improvements and I wouldn't try arguing against it. Then flame graph the microbenchmark to understand the hot function.

Java 145
article thumbnail

Extend infrastructure observability with JMX Extensions and additional full-stack metrics

Dynatrace

Issues that manifest themselves as performance degradation on a user’s device can often be traced back to underlying infrastructure issues. Monitor any infrastructure component and backing service that’s written in Java. Until now JMX and PMI extensions were only available in full-stack monitoring mode. Dynatrace news.

article thumbnail

The road to observability demo part 3: Collect, instrument, and analyze telemetry data automatically with Dynatrace

Dynatrace

Making applications observable—relying on metrics, logs, and traces to understand what software is doing and how it’s performing—has become increasingly important as workloads are shifting to multicloud environments. This will get us straight to the application page, where we get more insight on how our front end actually performs.

Metrics 168
article thumbnail

Announcing enterprise-grade observability at scale for your OpenTelemetry custom metrics

Dynatrace

As the application owner of an e-commerce application, for example, you can enrich the source code of your application with domain-specific knowledge by adding actionable semantics to collected performance or business metrics. Gathering performance metrics like memory usage from systems where an agent can’t be installed.

Metrics 150