Remove Availability Remove Code Remove Metrics Remove Servers
article thumbnail

Unmatched scalability and security of Dynatrace extensions now available for all supported technologies: 7 reasons to migrate your JMX and Python plugins

Dynatrace

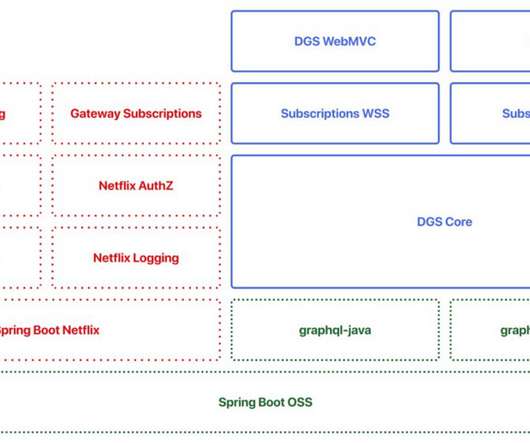
focused on technology coverage, building on the flexibility of JMX for Java and Python-based coded extensions for everything else. While Python code can address most data acquisition and ingest requirements, it comes at the cost of complexity in implementation and use-case modeling. Comprehensive metrics support Extensions 2.0

article thumbnail

Crucial Redis Monitoring Metrics You Must Watch

Scalegrid

You will need to know which monitoring metrics for Redis to watch and a tool to monitor these critical server metrics to ensure its health. Redis returns a big list of database metrics when you run the info command on the Redis shell. You can pick a smart selection of relevant metrics from these.

Metrics 130
Insiders

Sign Up for our Newsletter

This site is protected by reCAPTCHA and the Google Privacy Policy and Terms of Service apply.

Trending Sources

article thumbnail

The road to observability with OpenTelemetry demo part 1: Identifying metrics and traces

Dynatrace

That is, relying on metrics, logs, and traces to understand what software is doing and where it’s running into snags. When software runs in a monolithic stack on on-site servers, observability is manageable enough. In addition to tracing, observability also defines two other key concepts, metrics and logs. What is OpenTelemetry?

Metrics 185
article thumbnail

How to collect Prometheus metrics in Dynatrace

Dynatrace

Dynatrace has recently extended its Kubernetes operator by adding a new feature, the Prometheus OpenMetrics Ingest , which enables you to import Prometheus metrics in Dynatrace and build SLO and anomaly detection dashboards with Prometheus data. Here we’ll explore how to collect Prometheus metrics and what you can achieve with them.

Metrics 206
article thumbnail

Software intelligence as code enables tailored observability, AIOps, and application security at scale

Dynatrace

Key components of GitOps are declarative infrastructure as code, orchestration, and observability. Many observability solutions don’t support an “as code” approach. Dynatrace enables software intelligence as code. Observability is required for effective collaboration and automation.

Code 222
article thumbnail

Dynatrace observability is now available for Red Hat OpenShift on the IBM® Power® architecture

Dynatrace

IBM Power servers enable customers to respond faster to business demands, protect data from core to cloud, and streamline insights and automation. Captures metrics, traces, logs, and other telemetry data in context. It also detects new containers and injects OneAgent code modules into application pods.

article thumbnail

Driving your FinOps strategy with observability best practices

Dynatrace

Flexible pricing models that offer discounts based on commitment or availability can greatly reduce cloud waste. This includes spot instances such as unused cloud capacity that’s available at a discounted price. An organization can ask Dynatrace, “Have you seen any oversized servers over X amount of time?”