Remove Availability Remove Blog Remove Latency Remove Storage
article thumbnail

Optimizing data warehouse storage

The Netflix TechBlog

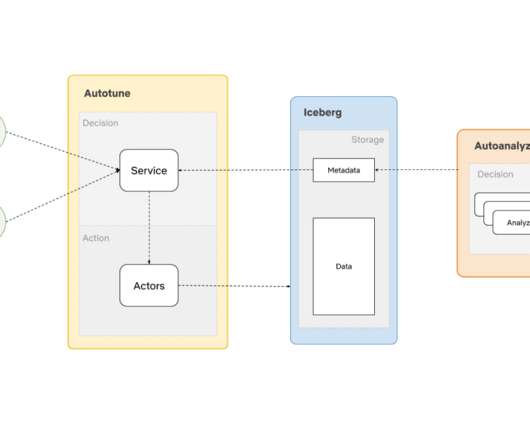
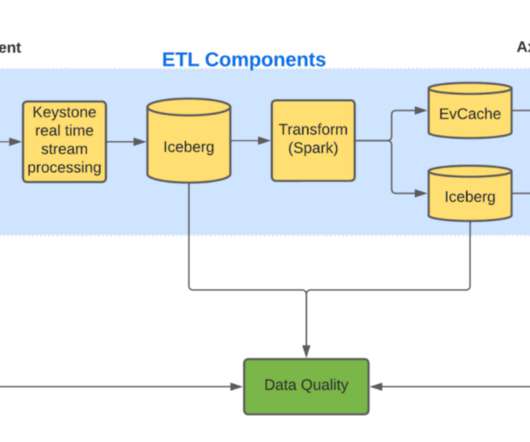
At this scale, we can gain a significant amount of performance and cost benefits by optimizing the storage layout (records, objects, partitions) as the data lands into our warehouse. We built AutoOptimize to efficiently and transparently optimize the data and metadata storage layout while maximizing their cost and performance benefits.

Storage 203
article thumbnail

Dynatrace Managed turnkey Premium High Availability for globally distributed data centers (Early Adopter)

Dynatrace

Dynatrace Managed is intrinsically highly available as it stores three copies of all events, user sessions, and metrics across its cluster nodes. The network latency between cluster nodes should be around 10 ms or less. Turnkey high availability across globally distributed data centers. Dynatrace news.

Insiders

Sign Up for our Newsletter

This site is protected by reCAPTCHA and the Google Privacy Policy and Terms of Service apply.

Trending Sources

article thumbnail

Migrating Critical Traffic At Scale with No Downtime?—?Part 1

The Netflix TechBlog

This blog series will examine the tools, techniques, and strategies we have utilized to achieve this goal. This blog post will provide a detailed analysis of replay traffic testing, a versatile technique we have applied in the preliminary validation phase for multiple migration initiatives.

Traffic 339
article thumbnail

Reducing Your Database Hosting Costs: DigitalOcean vs. AWS vs. Azure

Scalegrid

Since database hosting is more dependent on memory (RAM) than storage, we are going to compare various instance sizes ranging from just 1GB of RAM up to 64GB of RAM so you can see how costs vary across different application workloads. Is my database cluster still highly available? Does it affect latency? EC2 instances.

Azure 344
article thumbnail

Improved Alerting with Atlas Streaming Eval

The Netflix TechBlog

While Atlas is architected around compute & storage separation, and we could theoretically just scale the query layer to meet the increased query demand, every query, regardless of its type, has a data component that needs to be pushed down to the storage layer. The internals here are outside the scope of this blog post.

Storage 288
article thumbnail

Consistent caching mechanism in Titus Gateway

The Netflix TechBlog

This blog post presents how our current iteration of Titus deals with high API call volumes by scaling out horizontally. When a new leader is elected it loads all data from external storage. We started seeing increased response latencies and leader servers running at dangerously high utilization.

Cache 224
article thumbnail

Crucial Redis Monitoring Metrics You Must Watch

Scalegrid

This blog post lists the important database metrics to monitor. Key Takeaways Critical performance indicators such as latency, CPU usage, memory utilization, hit rate, and number of connected clients/slaves/evictions must be monitored to maintain Redis’s high throughput and low latency capabilities.

Metrics 130