Remove Analytics Remove Database Remove Download Remove Monitoring
article thumbnail

What is IT operations analytics? Extract more data insights from more sources

Dynatrace

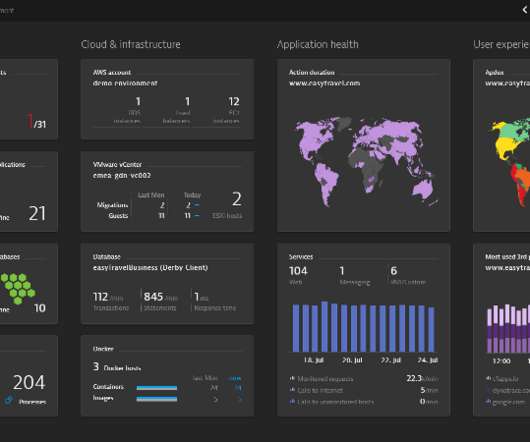
With 99% of organizations using multicloud environments , effectively monitoring cloud operations with AI-driven analytics and automation is critical. IT operations analytics (ITOA) with artificial intelligence (AI) capabilities supports faster cloud deployment of digital products and services and trusted business insights.

Analytics 184
article thumbnail

Extend business observability: Extract business events from online databases (Part 1)

Dynatrace

There are also many cases where business data—transactional, inventory, or financial—is at rest or in use , stored in a database. Dynatrace extensions can easily query data from various databases and store the results in Grail™, the Dynatrace data lakehouse. This can be accomplished using Dynatrace extensions.

Database 223
Insiders

Sign Up for our Newsletter

This site is protected by reCAPTCHA and the Google Privacy Policy and Terms of Service apply.

Trending Sources

article thumbnail

Extend business observability: Extract business events from online databases (Part 2)

Dynatrace

In part 2, we’ll show you how to retrieve business data from a database, analyze that data using dashboards and ad hoc queries, and then use a Davis analyzer to predict metric behavior and detect behavioral anomalies. Dynatrace users typically use extensions to pull technical monitoring data, such as device metrics, into Dynatrace.

Database 266
article thumbnail

TTP-based threat hunting with Dynatrace Security Analytics and Falco Alerts solves alert noise

Dynatrace

In this blog post, we’ll use Dynatrace Security Analytics to go threat hunting, bringing together logs, traces, metrics, and, crucially, threat alerts. Likewise, operation specialists can prioritize their efforts on monitoring the highest-risk tactics, and executives can better communicate the business risk.

Analytics 192
article thumbnail

PMM Dump GUI in Percona Monitoring and Management 2.41.0

Percona

A couple of weeks ago, we announced the first GA release of the PMM Dump : a new support tool that dumps Percona Monitoring and Management (PMM) metrics and Query Analytics (QAN) data to transfer to the expert engineer for review and performance suggestions. Download Percona Monitoring and Management Today

article thumbnail

Percona Monitoring and Management Dump: A New Tool to Support Percona Customers

Percona

In this post, I will present a new Percona tool: Percona Monitoring and Management (PMM) Dump. PMM Dump allows you to share monitoring data collected by your PMM server securely with the Percona Support team. PMM Dump is a command line tool that can be downloaded from [link]. It will not collect query analytics data by default.

article thumbnail

What is Application Performance Monitoring?

Dynatrace

Application Performance Monitoring (APM) in its simplest terms is what practitioners use to ensure consistent availability, performance, and response times to applications. Websites, mobile apps, and business applications are typical use cases for monitoring. Performance monitoring. Application monitoring. Dynatrace news.