Remove 2019 Remove Metrics Remove Network Remove Speed
article thumbnail

Site reliability done right: 5 SRE best practices that deliver on business objectives

Dynatrace

As a result, site reliability has emerged as a critical success metric for many organizations. Uptime Institute’s 2022 Outage Analysis report found that over 60% of system outages resulted in at least $100,000 in total losses, up from 39% in 2019. More than one in seven outages cost more than $1 million.

article thumbnail

Integrate Dynatrace more easily using the new Metrics REST API

Dynatrace

As a full stack monitoring platform, Dynatrace collects a huge number of metrics for each OneAgent monitored host in your environment. Depending on the types of technologies you’re running on your individual hosts, the average number of metrics is about 500 per computational node. New metric identifiers and structure.

Metrics 102
Insiders

Sign Up for our Newsletter

This site is protected by reCAPTCHA and the Google Privacy Policy and Terms of Service apply.

Trending Sources

article thumbnail

Front-End Performance Checklist 2019 [PDF, Apple Pages, MS Word]

Smashing Magazine

Front-End Performance Checklist 2019 [PDF, Apple Pages, MS Word]. Front-End Performance Checklist 2019 [PDF, Apple Pages, MS Word]. 2019-01-07T12:00:13+00:00. 2019-04-29T18:34:58+00:00. Getting Ready: Planning And Metrics. Getting Ready: Planning And Metrics. Vitaly Friedman. Table Of Contents.

article thumbnail

Container security: What it is, why it’s tricky, and how to do it right

Dynatrace

In 2019, Gartner reported that 30% of organizations worldwide were running containerized applications. To function effectively, containers need to be able to communicate with each other and with network services. Network scanners that see systems from the “outside” perspective. Network scanners.

article thumbnail

The Performance Inequality Gap, 2023

Alex Russell

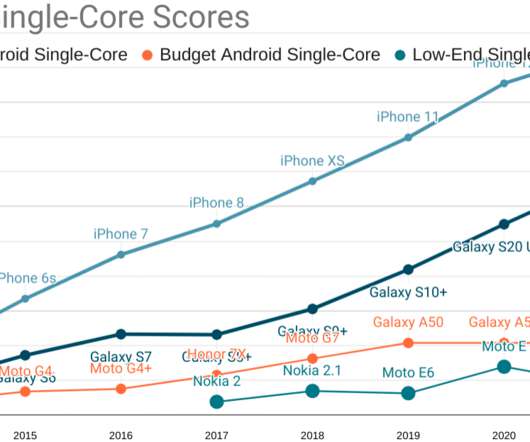
TL;DR : To serve users at the 75 th percentile ( P75 ) of devices and networks, we can now afford ~150KiB of HTML/CSS/fonts and ~300-350KiB of JavaScript (gzipped). This is a slight improvement on last year's budgets , thanks to device and network improvements. This is an ethical crisis for the frontend. 2023 Content Targets #.

article thumbnail

The Performance Inequality Gap, 2021

Alex Russell

Thanks to progress in networks and browsers (but not devices), a more generous global budget cap has emerged for sites constructed the "modern" way: ~100KiB of HTML/CSS/fonts and ~300-350KiB of JS (compressed) is the new rule-of-thumb limit for at least the next year or two. Modern network performance and availability.

article thumbnail

Reducing HTML Payload With Next.js (Case Study)

Smashing Magazine

In 2019, we sold 500k tickets a year, so our operations are complex and we need to showcase it with our landing pages in an appealing and fast manner. But first, let’s talk about the importance of speed improvement. Why Is Speed Improvement Necessary To Our SEO Efforts? You may be wondering why we need such a scale. Conclusions.

Google 110