Remove 2019 Remove Availability Remove Hardware Remove Monitoring
article thumbnail

Install private Synthetic monitoring locations on Linux faster with the new automated workflow

Dynatrace

Synthetic monitoring locations execute browser and HTTP monitors from within your own infrastructure and answer questions about the availability of applications (internal and external) from the perspective of specific points of interest such as branch offices. Dynatrace news. What’s next.

article thumbnail

Setting Up and Deploying PostgreSQL for High Availability

Percona

With the average cost of unplanned downtime running from $300,000 to $500,000 per hour , businesses are increasingly using high availability (HA) technologies to maximize application uptime. Where a high availability design once worked well, it can no longer keep up with more complex requirements. there cannot be high availability.

Insiders

Sign Up for our Newsletter

This site is protected by reCAPTCHA and the Google Privacy Policy and Terms of Service apply.

Trending Sources

article thumbnail

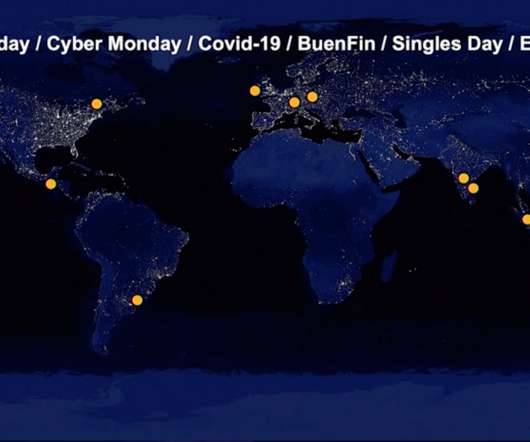
Dynatrace observability for e-commerce helps SAP deliver a record holiday shopping season

Dynatrace

Auer oversees the initiative to maintain the performance and availability of SAP Commerce Cloud , which underpins more than 3,500 e-commerce sites in more than 200 countries, processing transactions worth $500 billion annually. Digital experience revealed by real-user monitoring. SAP makes observability a first-class citizen.

Retail 240
article thumbnail

Modernize cloud operations to transform the way you work

Dynatrace

” Despite many challenges, when the project concluded in 2019, the team had the confidence and experience to migrate anything to the cloud. Today, VA uses Dynatrace to monitor over 150 different cloud instances — even hybrid instances of applications. “We used Dynatrace to monitor that large increase in servers.

Cloud 174
article thumbnail

Dynatrace Managed feature update, version 1.170

Dynatrace

Audit logs are available on individual nodes at DATASTORE_PATH/log/server. Cluster event audit logs are available as of Dynatrace Managed version 1.170. Additional audit log files will be made available in upcoming releases. Audit logs open up a whole new set of use cases for custom notifications using log monitoring tools.

Hardware 102
article thumbnail

OneAgent for Linux on IBM Z (General Availability)

Dynatrace

Having released this functionality in an Early Adopter Release with OneAgent version 1.173 and Dynatrace version 1.174 back in August 2019, we’re now happy to announce the General Availability of OneAgent full-stack monitoring for Linux on the IBM Z platform, sometimes informally referred to as Z/Linux.

article thumbnail

Front-End Performance Checklist 2019 [PDF, Apple Pages, MS Word]

Smashing Magazine

Front-End Performance Checklist 2019 [PDF, Apple Pages, MS Word]. Front-End Performance Checklist 2019 [PDF, Apple Pages, MS Word]. 2019-01-07T12:00:13+00:00. 2019-04-29T18:34:58+00:00. Testing And Monitoring. Good for raising alarms and monitoring changes over time, not so good for understanding user experience.