article thumbnail

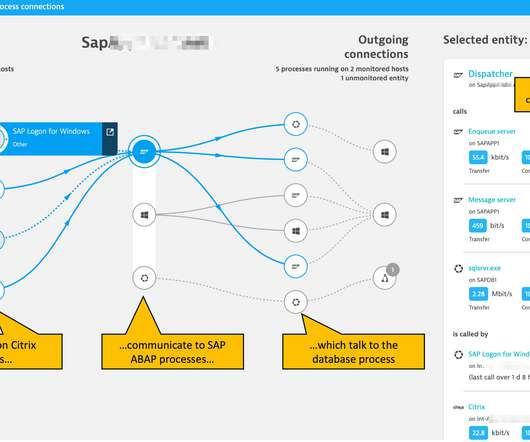
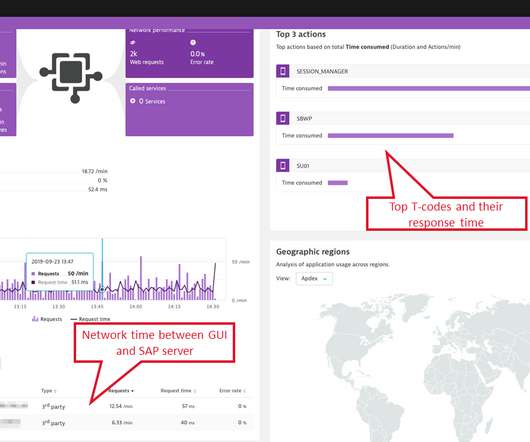
Citrix monitoring with Dynatrace: Easily observe your entire Citrix ecosystem

Dynatrace

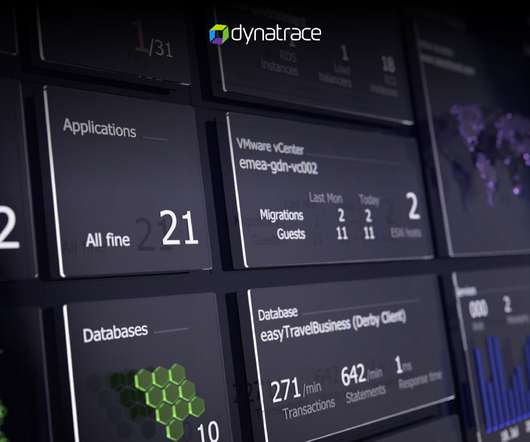
Automated AI-powered analytics are necessary to match the scale of monitoring these enterprises require. Our journey began in 2019 with the introduction of the Dynatrace Citrix monitoring extension. Listen, learn, improve, and repeat The latest update to the Citrix monitoring extension is now available.

article thumbnail

2019 Database Trends – SQL vs. NoSQL, Top Databases, Single vs. Multiple Database Use

Scalegrid

Wondering which databases are trending in 2019? So, which databases are most popular in 2019? are operating with one: 2019 Database Trends – SQL vs. NoSQL, Top Databases, Single vs. Multiple Database Use Click To Tweet. Monitoring came in at number one with 12.6% NoSQL Database Use: 39.52%. Most Popular Databases.

Database 255
Insiders

Sign Up for our Newsletter

This site is protected by reCAPTCHA and the Google Privacy Policy and Terms of Service apply.

Trending Sources

article thumbnail

Automated full-stack monitoring for SUSE CaaS 3.0 now available

Dynatrace

SUSECON 2019 took place a couple of weeks ago in Nashville, Tennessee. which is available as of now. Getting started with full-stack monitoring for your SUSE CaaS environment is easy. CPUs are still available for running additional containers. The post Automated full-stack monitoring for SUSE CaaS 3.0

article thumbnail

Reporting at scale leveraging cross-environment dashboards (General Availability)

Dynatrace

We’re happy to announce the General Availability of cross-environment dashboarding capabilities (having released this functionality in an Early Adopter release with Dynatrace version 1.172 back in June 2019). Monitoring the enterprise cloud poses many challenges when it comes to scale. Dynatrace news.

article thumbnail

Which Is the Best PostgreSQL GUI? 2019 Comparison

Scalegrid

It is difficult to browse database and tables, check indexes, and monitor databases through the console. The dashboard lets you monitor server activities such as database locks, connected sessions, and prepared transaction. It has one of the best editors – multiple data views are available to support a variety of user needs.

article thumbnail

Setting Up and Deploying PostgreSQL for High Availability

Percona

With the average cost of unplanned downtime running from $300,000 to $500,000 per hour , businesses are increasingly using high availability (HA) technologies to maximize application uptime. Where a high availability design once worked well, it can no longer keep up with more complex requirements. there cannot be high availability.