Remove Latency Remove Monitoring Remove Open Source Remove Traffic
article thumbnail

Supporting Diverse ML Systems at Netflix

The Netflix TechBlog

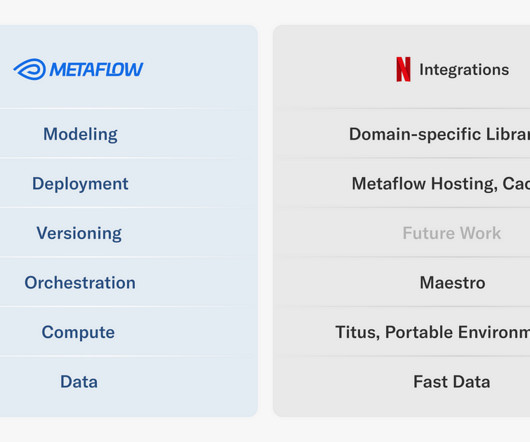
The Machine Learning Platform (MLP) team at Netflix provides an entire ecosystem of tools around Metaflow , an open source machine learning infrastructure framework we started, to empower data scientists and machine learning practitioners to build and manage a variety of ML systems.

Systems 226
article thumbnail

MySQL Key Performance Indicators (KPI) With PMM

Percona

A monitoring tool like Percona Monitoring and Management (PMM) is a popular choice among open source options for effectively monitoring MySQL performance. In this blog, we will explore various MySQL KPIs that are basic and essential to track using monitoring tools like PMM.

Insiders

Sign Up for our Newsletter

This site is protected by reCAPTCHA and the Google Privacy Policy and Terms of Service apply.

Trending Sources

article thumbnail

Understanding What Kubernetes Is Used For: The Key to Cloud-Native Efficiency

Percona

At its core, Kubernetes (often abbreviated as K8s) is an open source tool that automates the deployment, scaling, and management of containerized applications. Applications can be horizontally scaled with Kubernetes by adding or deleting containers based on resource allocation and incoming traffic demands.

article thumbnail

The road to observability demo part 3: Collect, instrument, and analyze telemetry data automatically with Dynatrace

Dynatrace

OpenTelemetry , the open source observability tool, has become the go-to standard for instrumenting custom applications to collect observability telemetry data. OneAgent is the native telemetry data collector and monitoring solution of Dynatrace. Host monitoring We start off with the very first layer: the host itself.

Metrics 168
article thumbnail

Building Netflix’s Distributed Tracing Infrastructure

The Netflix TechBlog

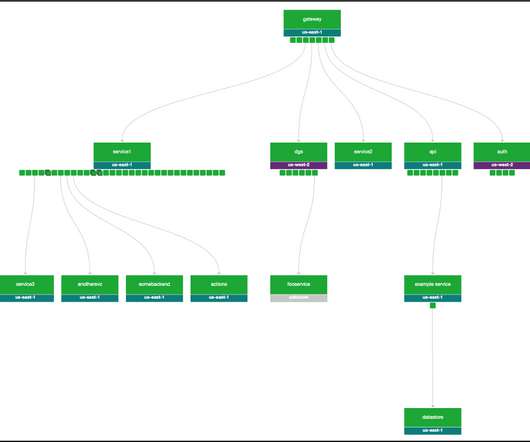
If we had an ID for each streaming session then distributed tracing could easily reconstruct session failure by providing service topology, retry and error tags, and latency measurements for all service calls. Additionally, it became easy to provide deep links to different monitoring and deployment systems in Edgar due to consistent tagging.

article thumbnail

The Best Way to Host MongoDB on DigitalOcean

Scalegrid

MongoDB is the #3 open source database and the #1 NoSQL database in the world. Azure and found that DigitalOcean performance was in line with, if not better, on both high throughput and low latency in the deployment. Monitoring Performance. Monitoring is also a huge component to managing a MongoDB deployment.

Azure 187
article thumbnail

Compression Methods in MongoDB: Snappy vs. Zstd

Percona

Snappy Data size: 14.95GB Data size after compression: 10.75GB Avg latency: 12.22ms Avg cpu usage: 34% Avg insert ops rate: 16K/s Time taken to import 120000000 document: 7292 seconds Zstd (with default compression level 6) Data size: 14.95GB Data size after compression: 7.69GB Avg latency: 12.52ms Avg cpu usage: 31.72% Avg insert ops rate: 14.8K/s

Storage 111