Remove Infrastructure Remove Metrics Remove Monitoring Remove Servers
article thumbnail

Easily monitor IBM i with updated Dynatrace extension

Dynatrace

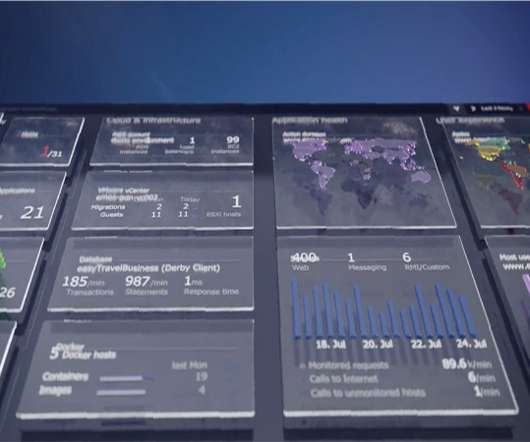
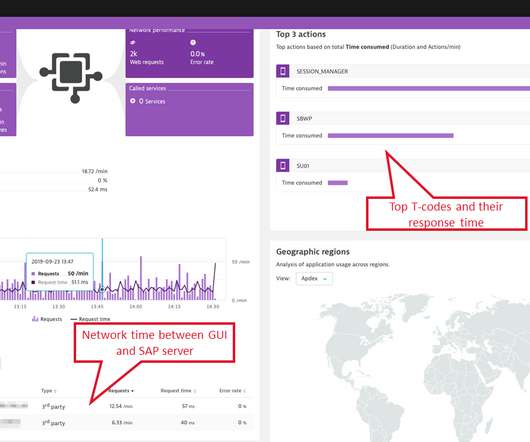
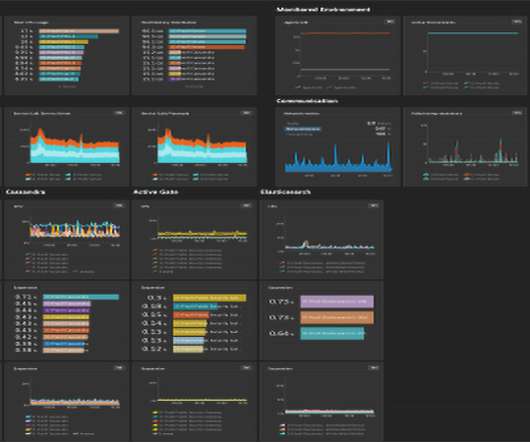
IBM i, formerly known as iSeries, is an operating system developed by IBM for its line of IBM i Power Systems servers. It’s all monitored remotely ! Default dashboard for IBM I monitoring The default dashboard provides an overview of all monitored systems and how many different entities are created by IBM i components.

article thumbnail

AI-powered infrastructure monitoring for your SAP HANA database (Preview)

Dynatrace

Don’t worry, when it comes to SAP monitoring, Dynatrace has you covered. Dynatrace ActiveGate extensions allow you to integrate Dynatrace monitoring with any remote technology that exposes an interface. Today we’re proud to announce that we’ve extended our SAP monitoring capabilities to support SAP HANA databases.

Insiders

Sign Up for our Newsletter

This site is protected by reCAPTCHA and the Google Privacy Policy and Terms of Service apply.

Trending Sources

article thumbnail

Extend infrastructure observability with JMX Extensions and additional full-stack metrics

Dynatrace

Infrastructure exists to support the backing services that are collectively perceived by users to be your web application. Issues that manifest themselves as performance degradation on a user’s device can often be traced back to underlying infrastructure issues. Monitor additional metrics. Dynatrace news.

article thumbnail

What is infrastructure monitoring and why is it mission-critical in the new normal?

Dynatrace

IT infrastructure is the heart of your digital business and connects every area – physical and virtual servers, storage, databases, networks, cloud services. We’ve seen the IT infrastructure landscape evolve rapidly over the past few years. What is infrastructure monitoring? . Dynatrace news.

article thumbnail

AI-powered DNS request tracking extends infrastructure observability for high quality network traffic

Dynatrace

Applications and services are often slowed down by under-performing DNS communications or misconfigured DNS servers, which can result in frustrated customers uninstalling your application. While our competitors only provide generic traffic monitoring without artificial intelligence, Dynatrace automatically analyzes DNS-related anomalies.

Traffic 264
article thumbnail

How to collect Prometheus metrics in Dynatrace

Dynatrace

Dynatrace has recently extended its Kubernetes operator by adding a new feature, the Prometheus OpenMetrics Ingest , which enables you to import Prometheus metrics in Dynatrace and build SLO and anomaly detection dashboards with Prometheus data. Here we’ll explore how to collect Prometheus metrics and what you can achieve with them.

Metrics 197
article thumbnail

Best Practices in Cloud Security Monitoring

Scalegrid

Cloud security monitoring is key—identifying threats in real-time and mitigating risks before they escalate. This article strips away the complexities, walking you through best practices, top tools, and strategies you’ll need for a well-defended cloud infrastructure. What does it take to secure your cloud assets effectively?