Remove Infrastructure Remove Metrics Remove Monitoring Remove Processing
article thumbnail

Trace, diagnose, resolve: Introducing the Infrastructure & Operations app for streamlined troubleshooting

Dynatrace

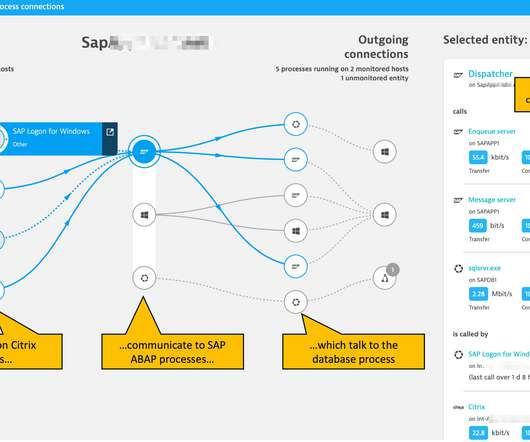
Infrastructure and operations teams must maintain infrastructure health for IT environments. To overcome these complex issues, teams must quickly find root causes among numerous alerts and metrics. Focusing on a particular data center reveals a detailed list of all the monitored hosts.

article thumbnail

Citrix monitoring with Dynatrace: Easily observe your entire Citrix ecosystem

Dynatrace

Citrix is critical infrastructure For businesses operating in industries with strict regulations, such as healthcare, banking, or government, Citrix virtual apps and virtual desktops are essential for simplified infrastructure management, secure application delivery, and compliance requirements.

Insiders

Sign Up for our Newsletter

This site is protected by reCAPTCHA and the Google Privacy Policy and Terms of Service apply.

Trending Sources

article thumbnail

Extend infrastructure observability with JMX Extensions and additional full-stack metrics

Dynatrace

Infrastructure exists to support the backing services that are collectively perceived by users to be your web application. Issues that manifest themselves as performance degradation on a user’s device can often be traced back to underlying infrastructure issues. Monitor additional metrics. Dynatrace news.

article thumbnail

How to collect Prometheus metrics in Dynatrace

Dynatrace

Dynatrace has recently extended its Kubernetes operator by adding a new feature, the Prometheus OpenMetrics Ingest , which enables you to import Prometheus metrics in Dynatrace and build SLO and anomaly detection dashboards with Prometheus data. Here we’ll explore how to collect Prometheus metrics and what you can achieve with them.

Metrics 197
article thumbnail

Extract metrics from business events to increase the value of business analytics

Dynatrace

But are observability platforms—born from the collision between the demands of cloud computing and the limitations of APM and infrastructure monitoring—the best solution for managing business analytics? Metric extraction is a convenient way to create your business metrics, delivering fast, flexible, and cost-effective analytics.

Analytics 197
article thumbnail

Observability engineering: Getting Prometheus metrics right for Kubernetes with Dynatrace and Kepler

Dynatrace

To get a more granular look into telemetry data, many analysts rely on custom metrics using Prometheus. Named after the Greek god who brought fire down from Mount Olympus, Prometheus metrics have been transforming observability since the project’s inception in 2012.

Metrics 175
article thumbnail

Best Practices in Cloud Security Monitoring

Scalegrid

Cloud security monitoring is key—identifying threats in real-time and mitigating risks before they escalate. This article strips away the complexities, walking you through best practices, top tools, and strategies you’ll need for a well-defended cloud infrastructure. What does it take to secure your cloud assets effectively?