Fri.Nov 22, 2019

article thumbnail

Google's Load Time Ranking Update

DZone

Performance testing makes the world turn. You may also like: Lessons From the Birth of Microservices at Google. You may have heard that as of early July, Google updated its search algorithm to include the load time of mobile URLs. While we knew this was coming back in January (way to go Google for the pre-update announcement). For the performance tester , it has real implications — let's take a look.

Google 173
article thumbnail

Netflix at AWS re:Invent 2019

The Netflix TechBlog

by Shefali Vyas Dalal AWS re:Invent is a couple weeks away and our engineers & leaders are thrilled to be in attendance yet again this year! Please stop by our “Living Room” for an opportunity to connect or reconnect with Netflixers. We’ve compiled our speaking events below so you know what we’ve been working on. We look forward to seeing you there!

AWS 100
Insiders

Sign Up for our Newsletter

This site is protected by reCAPTCHA and the Google Privacy Policy and Terms of Service apply.

Trending Sources

article thumbnail

The Eager Index Spool and The Optimizer

SQL Performance

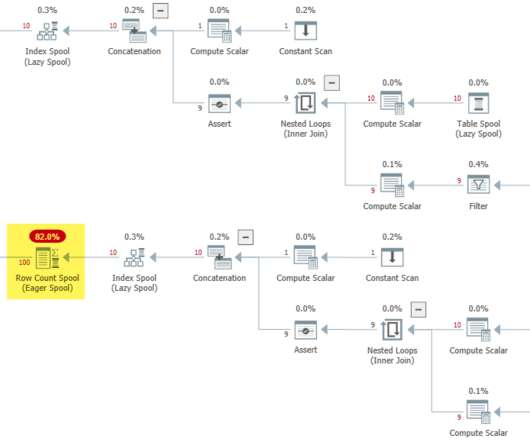
Introduction. An Eager Index Spool reads all rows from its child operator into an indexed worktable, before it starts returning rows to its parent operator. In some respects, an eager index spool is the ultimate missing index suggestion , but it is not reported as such. Cost assessment. Inserting rows into an indexed worktable is relatively low-cost, but not free.

Servers 77
article thumbnail

Netflix at AWS re:Invent 2019

The Netflix TechBlog

by Shefali Vyas Dalal AWS re:Invent is a couple weeks away and our engineers & leaders are thrilled to be in attendance yet again this year! Please stop by our “Living Room” for an opportunity to connect or reconnect with Netflixers. We’ve compiled our speaking events below so you know what we’ve been working on. We look forward to seeing you there!

AWS 100
article thumbnail

How to choose the right test framework for your Android CI/CD pipeline

TechBeacon Testing

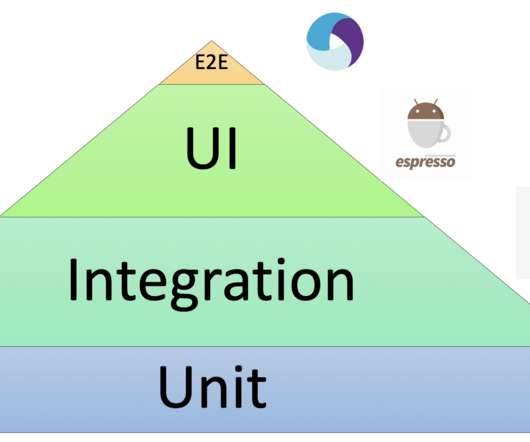
The Android platform, now more than 10 years old, has plenty of testing tools available. Java is even more mature, with a rich assortment of testing tools for Android projects.

Testing 72
article thumbnail

Operationalizing Performance with Performance Budgets

Rigor

When it comes to managing web performance, it’s vital to be proactive rather than reactive. To accomplish this goal, an organization needs to build internal processes and procedures that can operationalize a performance-first culture. The first step is to establish and implement web performance budgets. According to Tim Kadlec: A. The post Operationalizing Performance with Performance Budgets appeared first on Production.

article thumbnail

How to Graph HammerDB Response Times

HammerDB

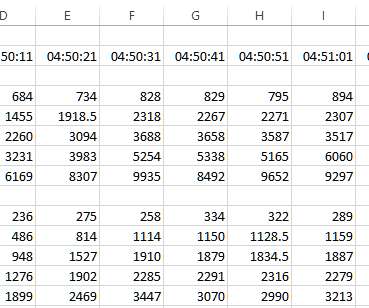
The HammerDB workload derived from TPC-C contains a feature to record the response times for the stored procedures that are run in the logfile. This post shows how you can easily convert this data into spreadsheet format to view the response times you have captured over a run. Firstly, to activate the time profile feature select Time Profile for the GUI or the set the equivalent parameter in the CLI to true.

More Trending

article thumbnail

Netflix at AWS re:Invent 2019

The Netflix TechBlog

by Shefali Vyas Dalal AWS re:Invent is a couple weeks away and our engineers & leaders are thrilled to be in attendance yet again this year! Please stop by our “Living Room” for an opportunity to connect or reconnect with Netflixers. We’ve compiled our speaking events below so you know what we’ve been working on. We look forward to seeing you there!

AWS 37
article thumbnail

Operationalizing Performance with Performance Budgets

Rigor

Reading time 9 min When it comes to managing web performance, it’s vital to be proactive rather than reactive. To accomplish this goal, an organization needs to build internal processes and procedures that can operationalize a performance-first culture. The first step is to establish and implement web performance budgets. According to Tim Kadlec : A performance budget is a clearly defined limit on one or more performance metrics that the team agrees not to exceed and that is used to guide design

article thumbnail

Build apps your customers love and grow your business with Dynatrace mobile monitoring

Dynatrace

Dynatrace news. Want to make your customers love your app? You need a smart approach to mobile app monitoring—Dynatrace monitoring for mobile apps provides comprehensive insights from mobile to back-end services, enabling you to provide great user experience for your apps and ultimately grow your business. We’re continuously adding support for new technologies like Apple tvOS while extending the existing feature set to new OS versions.

Mobile 33
article thumbnail

Celebrating One Year of Project To Product

Tasktop

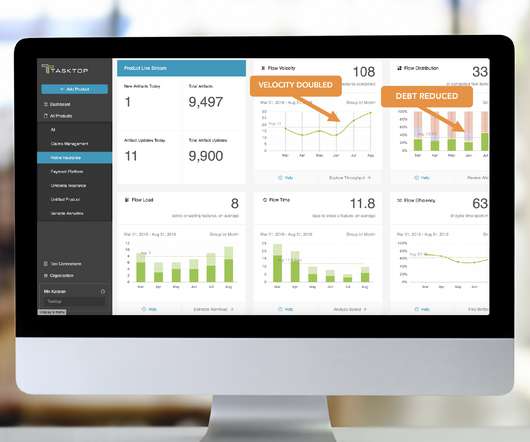
It’s been a year since the launch of Project to Product: How to Survive and Thrive in the Age of Digital Disruption with the Flow Framework , the bestselling book by Tasktop founder & CEO, Dr. Mik Kersten. With over 23,000 copies sold , the book currently sits within the Top 10 ‘Information Management’ bestsellers on Amazon, and with 56+ global event presentations delivered, it’s safe to say it’s been an action-packed year.

article thumbnail

Save build time and make life easier with the new Android auto-instrumentation

Dynatrace

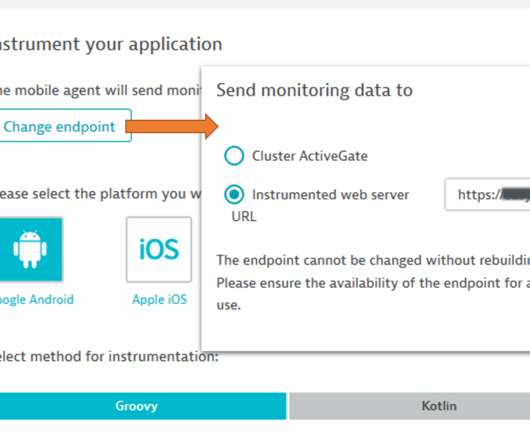
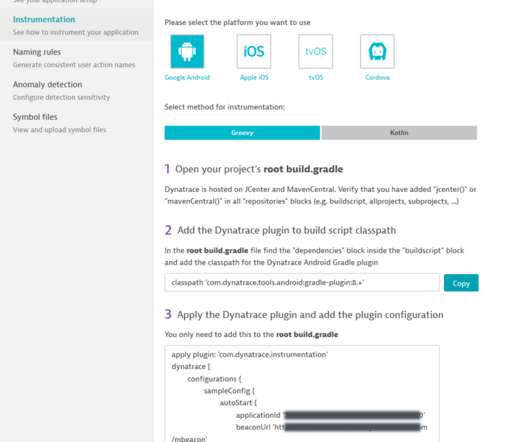
Dynatrace news. It’s only been a few months since we announced the Preview program for our super-fast Android auto-instrumentation—a great enhancement that’ll make your monitoring life easier and save you a lot of build time. More than 40 customers have joined the program and provided their feedback. Today we’re happy to announce that Dynatrace Android auto-instrumentation is Generally Available.

article thumbnail

Latest management zone update improves collaboration for Synthetic Monitoring

Dynatrace

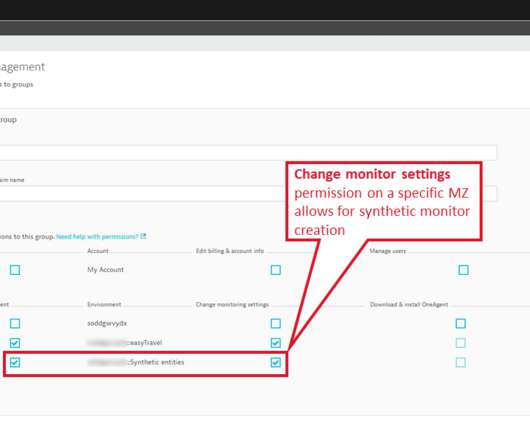
Dynatrace news. Dynatrace management zones provide an effective means of collaborating across teams by enabling you to define fine-grained access control to specific segments of monitoring data. Synthetic monitors (both HTTP and browser) can be assigned to management zones based either on their names or tags. Until now, users had to have the Change monitoring settings permission across an entire environment before they could create synthetic monitors.