article thumbnail

How multicloud observability boosts cloud performance at Tractor Supply Co.

Dynatrace

Rural lifestyle retail giant Tractor Supply Co. Kiran Bollampally, site reliability and digital analytics lead for ecommerce at Tractor Supply Co., discussed the 85-year-old retailer’s cloud migration journey and the importance of multicloud observability at Dynatrace Perform 2023. Further, as Tractor Supply Co.

Cloud 171
article thumbnail

eCommerce & Retail: There’s No Excuse to Ignore Performance

Rigor

Whether it be time, money, or technical know how, every day we talk to eCommerce and Retail teams who explain why they aren’t monitoring their site’s performance. But there are also eCommerce and Retail teams that integrate performance into their everyday process of building and releasing new content. Conclusion.

Insiders

Sign Up for our Newsletter

This site is protected by reCAPTCHA and the Google Privacy Policy and Terms of Service apply.

Trending Sources

article thumbnail

What is digital transformation? How to transform your business strategy

Dynatrace

The COVID-19 pandemic accelerated the speed at which organizations digitally transform — especially in industries such as eCommerce and healthcare — as expectations for a great customer experience dramatically increased.

Strategy 194
article thumbnail

A wine tasting with a difference…automation and AI

Dynatrace

Premier Farnell echoed this but from a different perspective – a large portion of their business comes from their global eCommerce websites, but the shift in business meant there were more eyes on the digital presence than ever. An eCommerce leader in designer menswear. Nevertheless, increased agility cuts both ways.

Ecommerce 132
article thumbnail

Why you need to know your site's performance poverty line (and how to find it)

Speed Curve

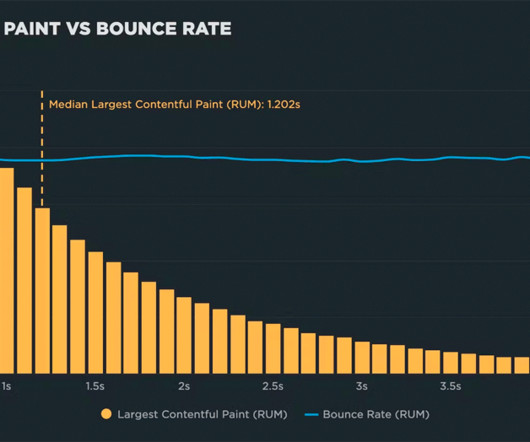
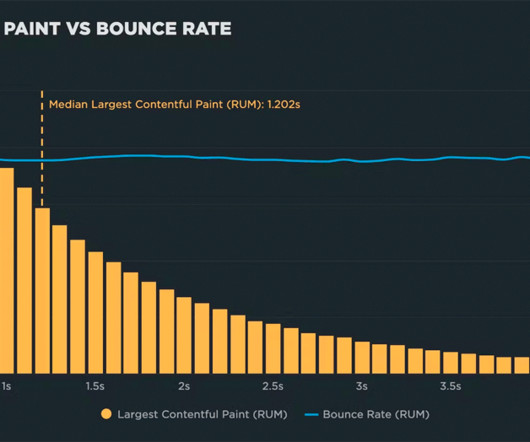
Poverty lines emerged for both Start Render and Largest Contentful Paint I expected the results for Start Render, as it's been around as a page speed metric for many years, and has been proven to correlate to business metrics. The blue bar represents the change in bounce rate across all cohorts. Ultimately, this is good for your business.

article thumbnail

Performance audit: Lego.com

Speed Curve

We track LEGO.com, along with a handful of other leading ecommerce sites, in our public-facing Retail Benchmarks dashboard , which I encourage you to check out. Optimizing the critical rendering path could make this page a star on the Retail Benchmarks leaderboard. Those are already big wins.

article thumbnail

Why you need to know your site's performance plateau (and how to find it)

Speed Curve

Plateaus emerged for both Start Render and Largest Contentful Paint I expected the results for Start Render, as it's been around as a page speed metric for many years, and has been proven to correlate to business metrics. The blue bar represents the change in bounce rate across all cohorts. Ultimately, this is good for your business.