Remove Design Remove Efficiency Remove Metrics Remove Storage
article thumbnail

Best practices for Fluent Bit 3.0

Dynatrace

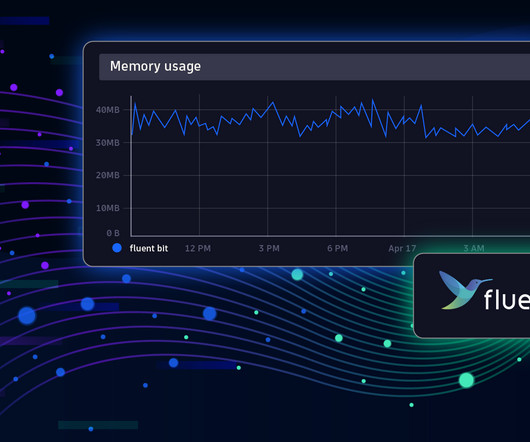
Fluent Bit is a telemetry agent designed to receive data (logs, traces, and metrics), process or modify it, and export it to a destination. Fluent Bit was designed to help you adjust your data and add the proper context, which can be helpful in the observability backend. Observability: Elevating Logs, Metrics, and Traces!

article thumbnail

Crucial Redis Monitoring Metrics You Must Watch

Scalegrid

You will need to know which monitoring metrics for Redis to watch and a tool to monitor these critical server metrics to ensure its health. Redis returns a big list of database metrics when you run the info command on the Redis shell. You can pick a smart selection of relevant metrics from these.

Metrics 130
Insiders

Sign Up for our Newsletter

This site is protected by reCAPTCHA and the Google Privacy Policy and Terms of Service apply.

Trending Sources

article thumbnail

MezzFS?—?Mounting object storage in Netflix’s media processing platform

The Netflix TechBlog

Mounting object storage in Netflix’s media processing platform By Barak Alon (on behalf of Netflix’s Media Cloud Engineering team) MezzFS (short for “Mezzanine File System”) is a tool we’ve developed at Netflix that mounts cloud objects as local files via FUSE. Our object storage service splits objects into many parts and stores them in S3.

Media 214
article thumbnail

Dynatrace Kubernetes Observability for Persistent Volume Claims

Dynatrace

Kubernetes was initially designed with a strong focus on stateless workloads, meaning these workloads do not need to store any persistent data. You quickly realize that it will take ages to fill up the overprovisioned database storage. Two days later, your database runs out of storage in the middle of the night. Dynatrace news.

Storage 188
article thumbnail

Dynatrace OpenPipeline: Stream processing data ingestion converges observability, security, and business data at massive scale for analytics and automation in context

Dynatrace

With siloed data sources, heterogeneous data types—including metrics, traces, logs, user behavior, business events, vulnerabilities, threats, lifecycle events, and more—and increasing tool sprawl, it’s next to impossible to offer users real-time access to data in a unified, contextualized view. Understanding the context.

Analytics 194
article thumbnail

The history of Grail: Why you need a data lakehouse

Dynatrace

These technologies are poorly suited to address the needs of modern enterprises—getting real value from data beyond isolated metrics. A data lakehouse addresses these limitations and introduces an entirely new architectural design. This decoupling ensures the openness of data and storage formats, while also preserving data in context.

article thumbnail

Enhance data management with Grail: Ultimate guide to custom buckets and security policies

Dynatrace

Grail: Enterprise-ready data lakehouse Grail, the Dynatrace causational data lakehouse, was explicitly designed for observability and security data, with artificial intelligence integrated into its foundation. Buckets are similar to folders, a physical storage location. There is a default bucket for each table.