Remove Cache Remove Latency Remove Operating System Remove Processing
article thumbnail

Crucial Redis Monitoring Metrics You Must Watch

Scalegrid

Key Takeaways Critical performance indicators such as latency, CPU usage, memory utilization, hit rate, and number of connected clients/slaves/evictions must be monitored to maintain Redis’s high throughput and low latency capabilities. It can achieve impressive performance, handling up to 50 million operations per second.

Metrics 130
article thumbnail

Redis® Monitoring Strategies for 2024

Scalegrid

Identifying key Redis® metrics such as latency, CPU usage, and memory metrics is crucial for effective Redis monitoring. With these essential support systems in place, you can effectively monitor your databases with up-to-date data about their health and functioning status at all times.

Strategy 130
Insiders

Sign Up for our Newsletter

This site is protected by reCAPTCHA and the Google Privacy Policy and Terms of Service apply.

Trending Sources

article thumbnail

Predictive CPU isolation of containers at Netflix

The Netflix TechBlog

Because microprocessors are so fast, computer architecture design has evolved towards adding various levels of caching between compute units and the main memory, in order to hide the latency of bringing the bits to the brains. Its goal is to assign running processes to time slices of the CPU in a “fair” way. Linux to the rescue?

Cache 251
article thumbnail

Taskbar Latency and Kernel Calls

Randon ASCII

While CPU Usage (Precise) is great for seeing how much CPU time a process is using, and why it is sitting idle, the CPU Usage (Sampled) table is the right tool for figuring out where CPU time is being spent. Remember that these are calls to the operating system – kernel calls. That is an average read of 68 bytes each time.

Latency 79
article thumbnail

The evolution of single-core bandwidth in multicore processors

John McCalpin

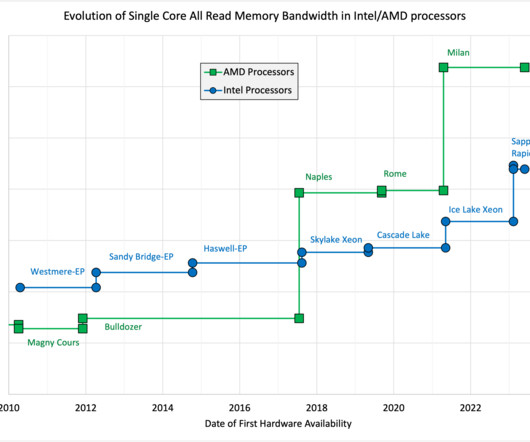
For most high-end processors these values have remained in the range of 75% to 85% of the peak DRAM bandwidth of the system over the past 15-20 years — an amazing accomplishment given the increase in core count (with its associated cache coherence issues), number of DRAM channels, and ever-increasing pipelining of the DRAMs themselves.

article thumbnail

What is a Distributed Storage System

Scalegrid

The power of multiple nodes To ensure reliability through redundancy, these storage systems maintain multiple copies of identical data across various nodes. This process effectively duplicates essential parts of information to safeguard against potential loss.

Storage 130
article thumbnail

InnoDB Performance Optimization Basics

Percona

As datasets continue to grow in size, the amount of RAM required to store and process these datasets also increases. By caching hot datasets, indexes, and ongoing changes, InnoDB can provide faster response times and utilize disk IO in a much more optimal way. However, this variable has been deprecated since 8.0.30.