Remove Best Practices Remove Code Remove Hardware Remove Latency
article thumbnail

Crucial Redis Monitoring Metrics You Must Watch

Scalegrid

Key Takeaways Critical performance indicators such as latency, CPU usage, memory utilization, hit rate, and number of connected clients/slaves/evictions must be monitored to maintain Redis’s high throughput and low latency capabilities. <code> 127.0.0.1:6379> cmdstat_append:calls=797,usec=4480,usec_per_call=5.62

Metrics 130
article thumbnail

What is cloud migration?

Dynatrace

We’ll answer that question and explore cloud migration benefits and best practices for how to go through your migration smoothly. It requires purchasing, powering, and configuring physical hardware, training and retaining the staff capable of servicing and securing the machines, operating a data center, and so on.

Cloud 163
Insiders

Sign Up for our Newsletter

This site is protected by reCAPTCHA and the Google Privacy Policy and Terms of Service apply.

Trending Sources

article thumbnail

Friends don't let friends build data pipelines

Abhishek Tiwari

Here are 8 fallacies of data pipeline The pipeline is reliable Topology is stateless Pipeline is infinitely scalable Processing latency is minimum Everything is observable There is no domino effect Pipeline is cost­-effective Data is homogeneous The pipeline is reliable The inconvenient truth is that pipeline is not reliable.

Latency 63
article thumbnail

Mobile browser testing – what is it and when is it done?

Testsigma

The applications are designed using the same code base as Desktop like HTML, Javascript, and CSS. Each smartphone comes with various screen sizes and resolutions, operates on different network speeds, and has different hardware capabilities. Best Practices For Mobile Website Testing.

Mobile 52
article thumbnail

HammerDB MySQL and MariaDB Best Practice for Performance and Scalability

HammerDB

This post complements the previous best practice guides this time with the focus on MySQL and MariaDB and achieving top levels of performance with the HammerDB MySQL TPC-C test. As is also the case this limitation is at the database level (especially the storage engine) rather than the hardware level.

article thumbnail

The Speed of Time

Brendan Gregg

A Cassandra database cluster had switched to Ubuntu and noticed write latency increased by over 30%. The broken Java stacks turned out to be beneficial: They helped group together the os::javaTimeMillis() calls which otherwise might have have been scattered on top of different Java code paths, appearing as thin stacks everywhere.

Speed 126
article thumbnail

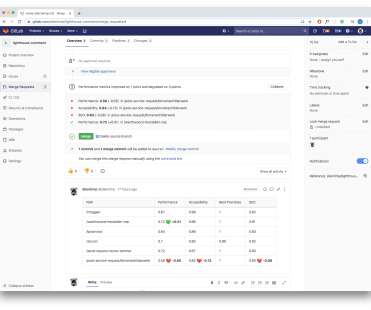
How To Make Performance Visible With GitLab CI And Hoodoo Of GitLab Artifacts

Smashing Magazine

It’s happening because of new features being added and the fact that we sometimes don’t have a second thought on packages that we constantly add and update, or think about the complexity of our code. In the case that new development changes the file size to the point of exceeding the defined limit, the script will complete with non-zero code.