article thumbnail

How to use Server Timing to get backend transparency from your CDN

Speed Curve

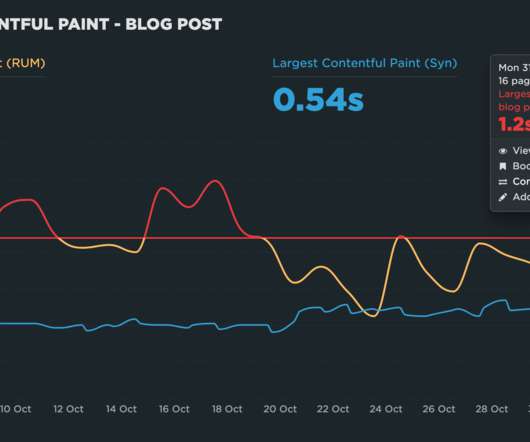
Server-timing headers are a key tool in understanding what's happening within that black box of Time to First Byte (TTFB). Looking at the industry benchmarks for US retailers , four well-known sites have backend times that are approaching – or well beyond – that threshold.

Servers 58
article thumbnail

The Speed of Time

Brendan Gregg

This server is spending about a third of its CPU cycles just checking the time! Measuring the speed of time Is there already a microbenchmark for os::javaTimeMillis()? Even with the broken Java stacks, I noticed a big difference: On Ubuntu, there's a massive amount of CPU time in a libjvm call: os::javaTimeMillis().

Speed 126
Insiders

Sign Up for our Newsletter

This site is protected by reCAPTCHA and the Google Privacy Policy and Terms of Service apply.

Trending Sources

article thumbnail

2023 Black Friday and Cyber Monday retail and e-commerce IT performance observations

Dynatrace

Social media was relatively quiet, and as always, the Dynatrace Insights team was benchmarking key retailer home pages from mobile and desktop perspectives. By focusing on the server, digital performance has become much more consistent, even under the weight of massive amounts of consumer load.

Retail 220
article thumbnail

Crucial Redis Monitoring Metrics You Must Watch

Scalegrid

You will need to know which monitoring metrics for Redis to watch and a tool to monitor these critical server metrics to ensure its health. Effective monitoring of key performance indicators plays a crucial role in maintaining this optimal speed of operation. You can pick a smart selection of relevant metrics from these.

Metrics 130
article thumbnail

Redis vs Memcached in 2024

Scalegrid

Introduction Caching serves a dual purpose in web development – speeding up client requests and reducing server load. Redis Revealed: An Overview Redis, a renowned open-source, in-memory remote dictionary server, stands out for its diverse data structures and advanced features. Data transfer technology.

Cache 130
article thumbnail

Measure What You Impact, Not What You Influence

CSS Wizardry

As I see it, there are two main issues when it comes to measuring performance changes (note, not improvements , but changes) in the lab: Site-speed is nondeterministic 1. We can take reasonable measures (always refresh from a cold cache; throttle to a constant network speed), but we can’t account for everything. Isolate Your Impact.

article thumbnail

How To Scale a Single-Host PostgreSQL Database With Citus

Percona

PostgreSQL Cluster One coordinator node citus-coord-01 Three worker nodes citus1 citus2 citus3 Hardware AWS Instance Ubuntu Server 20.04, SSD volume type 64-bit (x86) c5.xlarge And now, execute the benchmark: -- execute the following on the coordinator node pgbench -c 20 -j 3 -T 60 -P 3 pgbench The results are not pretty.

Database 103