article thumbnail

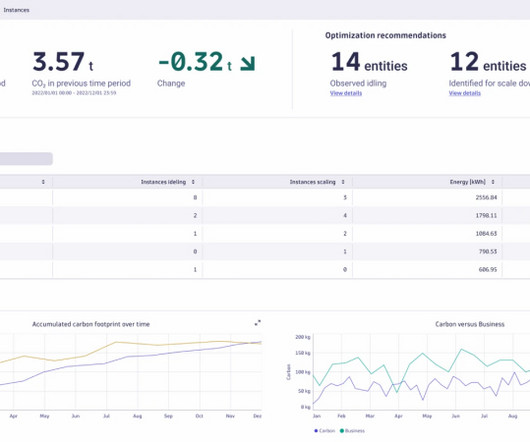
IT carbon footprint: Dynatrace Carbon Impact and Optimization app helps organizations measure cloud computing carbon footprint

Dynatrace

As global warming advances, growing IT carbon footprints are pushing energy-efficient computing to the top of many organizations’ priority lists. Energy efficiency is a key reason why organizations are migrating workloads from energy-intensive on-premises environments to more efficient cloud platforms.

Energy 233
article thumbnail

What is FinOps? How to keep cloud spend in check

Dynatrace

Today, many global industries implement FinOps, including telecommunications, retail, manufacturing, and energy conservation, as well as most Fortune 50 companies. Additionally, include benchmarks for stakeholders and best practices that support the anticipated growth of the organization as a whole. FinOps company culture.

Cloud 195
Insiders

Sign Up for our Newsletter

This site is protected by reCAPTCHA and the Google Privacy Policy and Terms of Service apply.

Trending Sources

article thumbnail

How to maximize CPU performance for PostgreSQL 12.0 benchmarks on Linux

HammerDB

HammerDB doesn’t publish competitive database benchmarks, instead we always encourage people to be better informed by running their own. So over at Phoronix some database benchmarks were published showing PostgreSQL 12 Performance With AMD EPYC 7742 vs. Intel Xeon Platinum 8280 Benchmarks .

article thumbnail

The Surprising Effectiveness of Non-Overlapping, Sensitivity-Based Performance Models

John McCalpin

To show that I can criticize my own work as well, here I show that sustained memory bandwidth (using an approximation to the STREAM Benchmark ) is also inadequate as a single figure of metric. (It Over time, the mechanisms introduced for reducing energy consumption (first in laptops) became available more broadly.

article thumbnail

A Complete Guide to Performance Budgets

Speed Curve

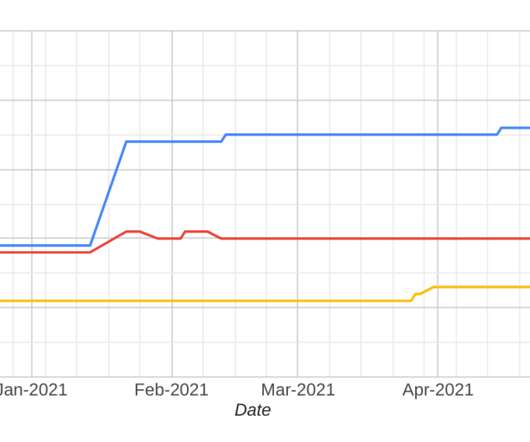
A performance budget is a threshold that you apply to the metrics you care about the most. A good performance budget chart, such as the one above, should show you: The metric you're tracking The threshold you've created for that metric When you exceed that threshold How long you stayed out of bounds When you returned to below the threshold 3.

article thumbnail

Why engaged teams are not always the best performers?

Abhishek Tiwari

Traditional engagement metrics such as satisfaction, happiness, well-being let alone cannot explain behaviours, actions and motivation of a high-performance team. Motivation represents a positive energy, at the other end of the spectrum is we have burnout. They set a higher benchmark for themselves.

article thumbnail

Google Lighthouse vs Rigor

Rigor

Reading time 11 min As companies become more aware of the importance of web performance, internal teams begin to research tools they can use to use to track their metrics and improve the user experience of their websites and applications. Hacking Lighthouse takes time, energy, and resources from your team.

Google 51