Remove c
article thumbnail

Why Tcl is 700% faster than Python for database benchmarking
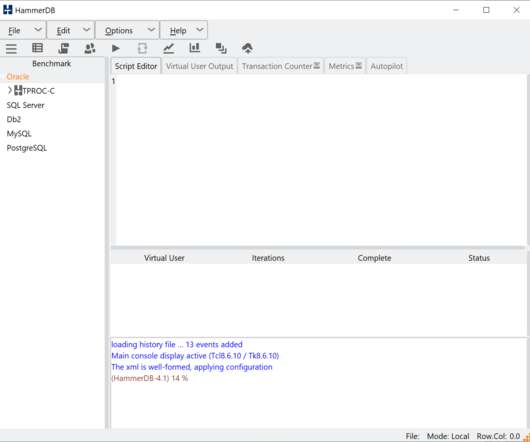
HammerDB

Python is a popular programming language, especially for beginners, and consequently we see it occurring in places where it just shouldn’t be used, such as database benchmarking. We use stored procedures because, as the introductory post shows, using single SQL statements turns our database benchmark into a network test).

article thumbnail

Grafana Dashboards: A PoC Implementing the PostgreSQL Extension pg_stat_monitor

Percona

Configuring Grafana For our purposes, the Grafana datasource used in this PoC is also the Postgres data cluster that is generating the data to be monitored. pg_stat_monitor About pg_stat_monitor is a Query Performance Monitoring tool for PostgreSQL. A script executing a benchmarking run: #!/bin/bash

Insiders

Sign Up for our Newsletter

This site is protected by reCAPTCHA and the Google Privacy Policy and Terms of Service apply.

Trending Sources

article thumbnail

Real Time Oracle Performance Monitoring for Benchmarks

HammerDB

An essential part of database performance testing is viewing the statistics generated by the database during the test and in 2009 HammerDB introduced automatic AWR snapshot generation for Oracle for the TPC-C test. With this feature Oracle generates a wealth of performance data that can be reviewed once the test is complete.

article thumbnail

HammerDB v4.0 New Features Pt1: TPROC-C & TPROC-H

HammerDB

compared to previous releases is that the workload names have changed from TPC-C and TPC-H to TPROC-C and TPROC-H respectively and therefore a key question is how are the v4.0 The simple answer is nothing, the workloads are exactly the same workloads derived from the TPC-C and TPC-H specifications and HammerDB v4.0

C++ 40
article thumbnail

HammerDB v4.9 New Feature: Accelerate SQL Server builds with BCP

HammerDB

by @krithikasatish and @JoshInnis to provide accelerated load performance for both SQL Server TPROC-C and TPROC-H schemas. Using BCP our TPROC-C build now completed almost 3X faster and tests on TPROC-H showed similar results. This post provides an introduction to the new feature added to HammerDB v4.9 With the default for v4.9

Servers 62
article thumbnail

How to evaluate modern APM solutions

Dynatrace

Application performance monitoring (APM) solutions have evolved in recent years, and organizations now have plenty of options to choose from when selecting the right tools for their needs. APM solutions track key software application performance metrics using monitoring software and telemetry data. Dynatrace news.

article thumbnail

Why you need to know your site's performance poverty line (and how to find it)

Speed Curve

For each site, I used a month's worth of RUM (real user monitoring) data to generate correlation charts. Site A Site B Site C Site D Observations 1. The poverty line emerges surprisingly quickly in some cases For example, Site C's performance poverty line starts at 400 milliseconds. That's early!