Remove Benchmarking Remove Best Practices Remove Cache Remove Metrics
article thumbnail

Crucial Redis Monitoring Metrics You Must Watch

Scalegrid

You will need to know which monitoring metrics for Redis to watch and a tool to monitor these critical server metrics to ensure its health. Redis returns a big list of database metrics when you run the info command on the Redis shell. You can pick a smart selection of relevant metrics from these.

Metrics 130
article thumbnail

Percona Monitoring and Management 2 Scaling and Capacity Planning

Percona

PMM2 uses VictoriaMetrics (VM) as its metrics storage engine. The VictoriaMetrics team has also published some best practices , which can also be referred to while planning for resources for setting up PMM2. VictoriaMetrics maintains an in-memory cache for mapping active time series into internal series IDs.

Insiders

Sign Up for our Newsletter

This site is protected by reCAPTCHA and the Google Privacy Policy and Terms of Service apply.

Trending Sources

article thumbnail

MySQL Key Performance Indicators (KPI) With PMM

Percona

This includes metrics such as query execution time, the number of queries executed per second, and the utilization of query cache and adaptive hash index. query cache: Disable (query_cache_size: 0, query_cache_type:OFF) innodb_adaptive_hash_index: Check adaptive hash index usage to determine its efficiency.

article thumbnail

Average Page Load Times for 2020 – Are you faster?

MachMetrics

Similar to our article Average Page Load Times for 2018 , we’ll go over the averages for metrics and help you determine if your site is faster or slower than average. As you know, there are many metrics that determine a website’s page speed, and we can’t look at just one of them to determine how performant our site is.

article thumbnail

MySQL Performance Tuning 101: Key Tips to Improve MySQL Database Performance

Percona

Key metrics such as CPU usage, memory usage, and disk I/O offer insights into how efficiently your database server operates. Efficient memory management, including optimizing query caches and buffer pools, can help strike the right balance between memory consumption and query response times.

Tuning 52
article thumbnail

Performance audit: Lego.com

Speed Curve

We track LEGO.com, along with a handful of other leading ecommerce sites, in our public-facing Retail Benchmarks dashboard , which I encourage you to check out. Are you compressing and caching the right things? The best way to investigate the critical rendering path is to look at a waterfall chart for the page page.

article thumbnail

Fixing a slow site iteratively

CSS - Tricks

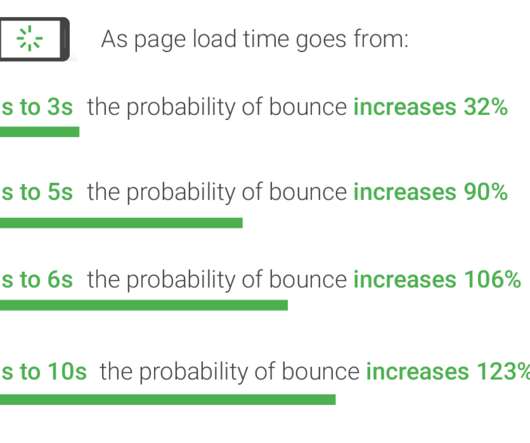
Site performance is potentially the most important metric. Google’s industry benchmarks from 2018 also provide a striking breakdown of how each second of loading affects bounce rates. Having a slow site might leave you on page 452 of search results, regardless of any other metric. Compressing, minifying and caching assets.

Cache 92