Remove Analytics Remove Google Remove Metrics Remove Video
article thumbnail

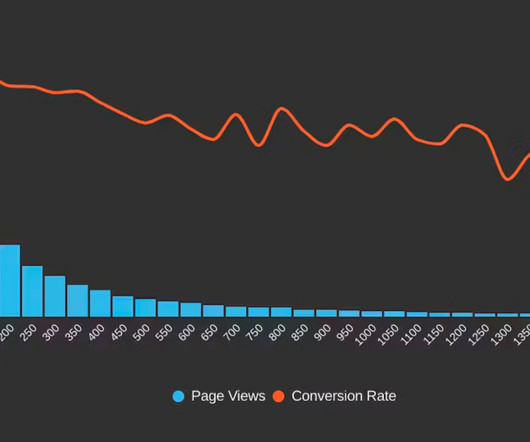
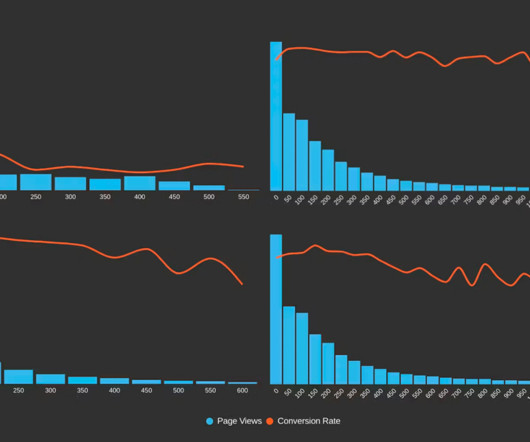
Does Interaction to Next Paint actually correlate to user behavior?

Speed Curve

Earlier this year, Google announced that Interaction to Next Paint (INP) is no longer an experimental metric. Now that INP has arrived to dethrone FID as the responsiveness metric in Core Web Vitals, we've turned our eye to scrutinizing its effectiveness. When it comes to new performance metrics, it's easy to jump on bandwagons.

Google 110
article thumbnail

Implementing service-level objectives to improve software quality

Dynatrace

By implementing service-level objectives, teams can avoid collecting and checking a huge amount of metrics for each service. Dynatrace provides a centralized approach for establishing, instrumenting, and implementing SLOs that uses full-stack observability , topology mapping, and AI-driven analytics. Define SLOs for each service.

Software 266
Insiders

Sign Up for our Newsletter

This site is protected by reCAPTCHA and the Google Privacy Policy and Terms of Service apply.

Trending Sources

article thumbnail

Farewell FID. and hello Interaction to Next Paint!

Speed Curve

Today at Google I/O 2023, it was announced that Interaction to Next Paint (INP) is no longer an experimental metric. It's been hugely helpful to have a simple set of three metrics – focused on loading, interactivity, and responsiveness – that everyone can understand and focus on. How does INP compare to FID?

Metrics 96
article thumbnail

What is session replay? Discover user pain points with session recordings

Dynatrace

Session replay is an IT technology that creates anonymized video-like recordings of actions taken by users interacting with your website or mobile application. The result is a complete recreation of the user experience in a video-like format. Improved analytic context. What is session replay? Why session replay matters.

Mobile 248
article thumbnail

Search Engine Optimization Checklist (PDF)

Smashing Magazine

The most beautiful, spectacular site in the world won’t do anyone much good if people can’t find it on Google (or Bing, or DuckDuckGo). It is a huge industry, with its own publications, thought leaders, podcasts, video series, and more. Prioritizing Metrics Online metrics are almost limitless. Google Keyword Planner.

article thumbnail

An Opinionated Guide to Performance Budgets

Speed Curve

Web pages are unbelievably complex, and there are hundreds of different metrics available to track. A performance budget is a threshold that you apply to the metrics you care about the most. This is when you run into three important questions: Which metrics should you focus on? Which metrics should you focus on?

article thumbnail

10 things I love about SpeedCurve (that I think you'll love, too)

Speed Curve

The best way to fight regressions is to create performance budgets on key metrics, and get alerted when they go out of bounds. These charts let even the most non-technical stakeholder easily see the correlation between performance and user engagement and business metrics, such as bounce rate and conversion rate.