Remove Analytics Remove Benchmarking Remove Network Remove Training
article thumbnail

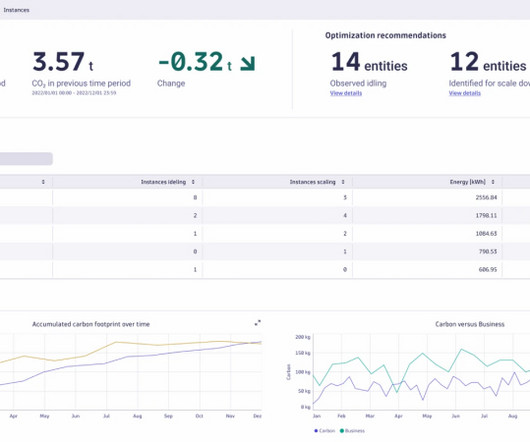
IT carbon footprint: Dynatrace Carbon Impact and Optimization app helps organizations measure cloud computing carbon footprint

Dynatrace

Research from 2020 suggests that training a single LLM generates around 300,000 kg of carbon dioxide emissions—equal to 125 round-trip flights from New York to London. The app’s advanced algorithms and real-time data analytics translate utilization metrics into their CO2 equivalent (CO2e).

Energy 226
article thumbnail

Introducing Page Speed Benchmarks – a new resource for the performance community

Speed Curve

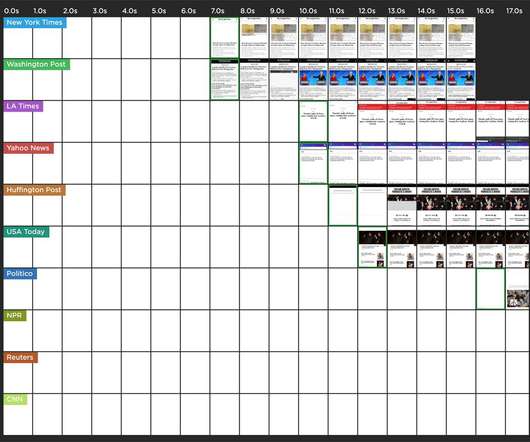
What are some good sites I can use for benchmarking? Page Speed Benchmarks is an interactive dashboard that lets you explore and compare web performance data for leading websites across several industries – from retail to media. Identify sites you can use for your own competitive benchmarking. How fast should I be?

Insiders

Sign Up for our Newsletter

This site is protected by reCAPTCHA and the Google Privacy Policy and Terms of Service apply.

Trending Sources

article thumbnail

What Is a Workload in Cloud Computing

Scalegrid

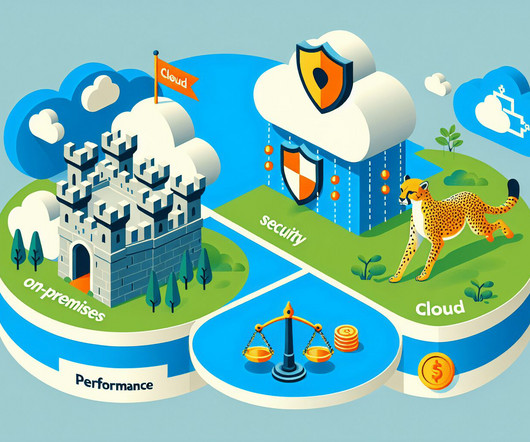
This is sometimes referred to as using an “over-cloud” model that involves a centrally managed resource pool that spans all parts of a connected global network with internal connections between regional borders, such as two instances in IAD-ORD for NYC-JS webpage DNS routing. Additionally. This also aids scalability down the line.

Cloud 130
article thumbnail

Lerner?—?using RL agents for test case scheduling

The Netflix TechBlog

Netflix engineers run a series of tests and benchmarks to validate the device across multiple dimensions including compatibility of the device with the Netflix SDK, device performance, audio-video playback quality, license handling, encryption and security. Likewise it has very low requirements on the initial amount of training data.

Testing 163
article thumbnail

The Performance Inequality Gap, 2024

Alex Russell

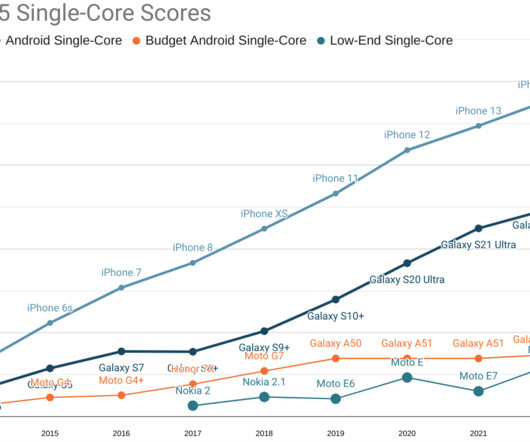
It's time once again to update our priors regarding the global device and network situation. seconds on the target device and network profile, consuming 120KiB of critical path resources to become interactive, only 8KiB of which is script. What's changed since last year? and 75KiB of JavaScript. These are generous targets.

article thumbnail

CDN Web Application Firewall (WAF): Your Shield Against Online Threats

IO River

The OSI Model is like a layer cake of how data moves through networks. This means it specifically looks at the content of the data (like the writing inside our letters from the analogy) rather than just the envelope.So, what is the difference between a Firewall at the application level and network level?Network-level

Traffic 52
article thumbnail

CDN Web Application Firewall (WAF): Your Shield Against Online Threats

IO River

The OSI Model is like a layer cake of how data moves through networks. This means it specifically looks at the content of the data (like the writing inside our letters from the analogy) rather than just the envelope.So, what is the difference between a Firewall at the application level and network level?Network-level

Traffic 40